# VJMap Visualization
# Video Tutorials
VJMap Visualization: Parking Lot Path Planning (opens new window) https://www.bilibili.com/video/BV1oX4y1r7L3/ (opens new window)
# Introduction
VJMap (opens new window) provides a one-stop solution for CAD or custom map format WebGIS visualization development. It supports formats such as the commonly used AutoCAD DWG format and GeoJSON and other common GIS file formats. It uses WebGL vector tiles and custom styles to render interactive maps and provides new big data visualization capabilities.
VJMap Visualization Platform (opens new window) (open source) aims to create an intuitive, easy-to-use map display interface, providing users with a simple, efficient, and precise CAD map Web visualization solution and a CAD map WebGIS low-code platform.
# Concepts
A map typically consists of a base map, data sources, layers, and UI controls.
Base Map
The base map refers to the layer at the bottom of all layers and graphics. The base map can be CAD, or it can use internet maps such as Tianditu or Amap as the base map.
Data Source
Maps decouple data supply from layer rendering. Data sources define the data format and loading method of underlying data. Based on the data content requested by data sources, different layers visualize all or part of the data to complete the map rendering.
Data sources include: GeoJSON, raster tile URLs, vector tile URLs, video URLs, image URLs, etc.
Layers
Layers are basic units that make up a map. They define the appearance and behavior of the map. A layer is a set of visual elements for displaying data. Each layer can contain different types of geographic data and use various drawing styles for presentation.
Layers include: vector data layers, raster layers, heatmap layers, background layers, etc.
Some layers need to be bound to data sources. When data in the data source changes, the corresponding layer display will also change.
UI Controls Mainly used for map interaction or information display. Such as navigation controls, zoom controls, fullscreen controls, drawing controls, minimap controls, etc.
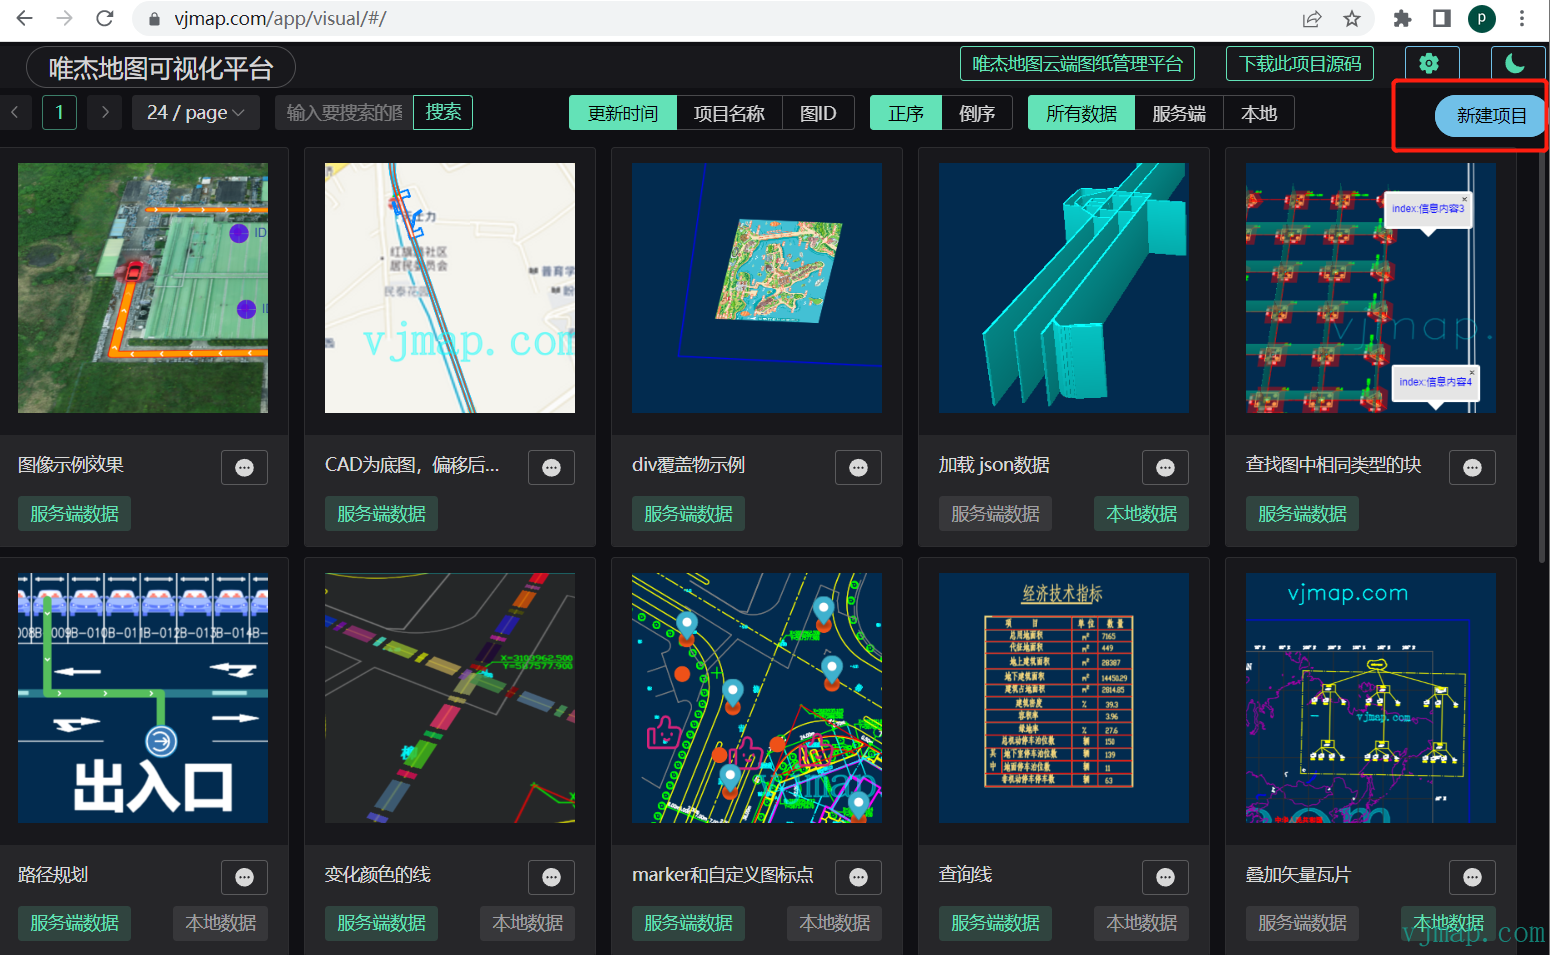
# VJMap Visualization Platform Overview
# Create New
# Select Base Map
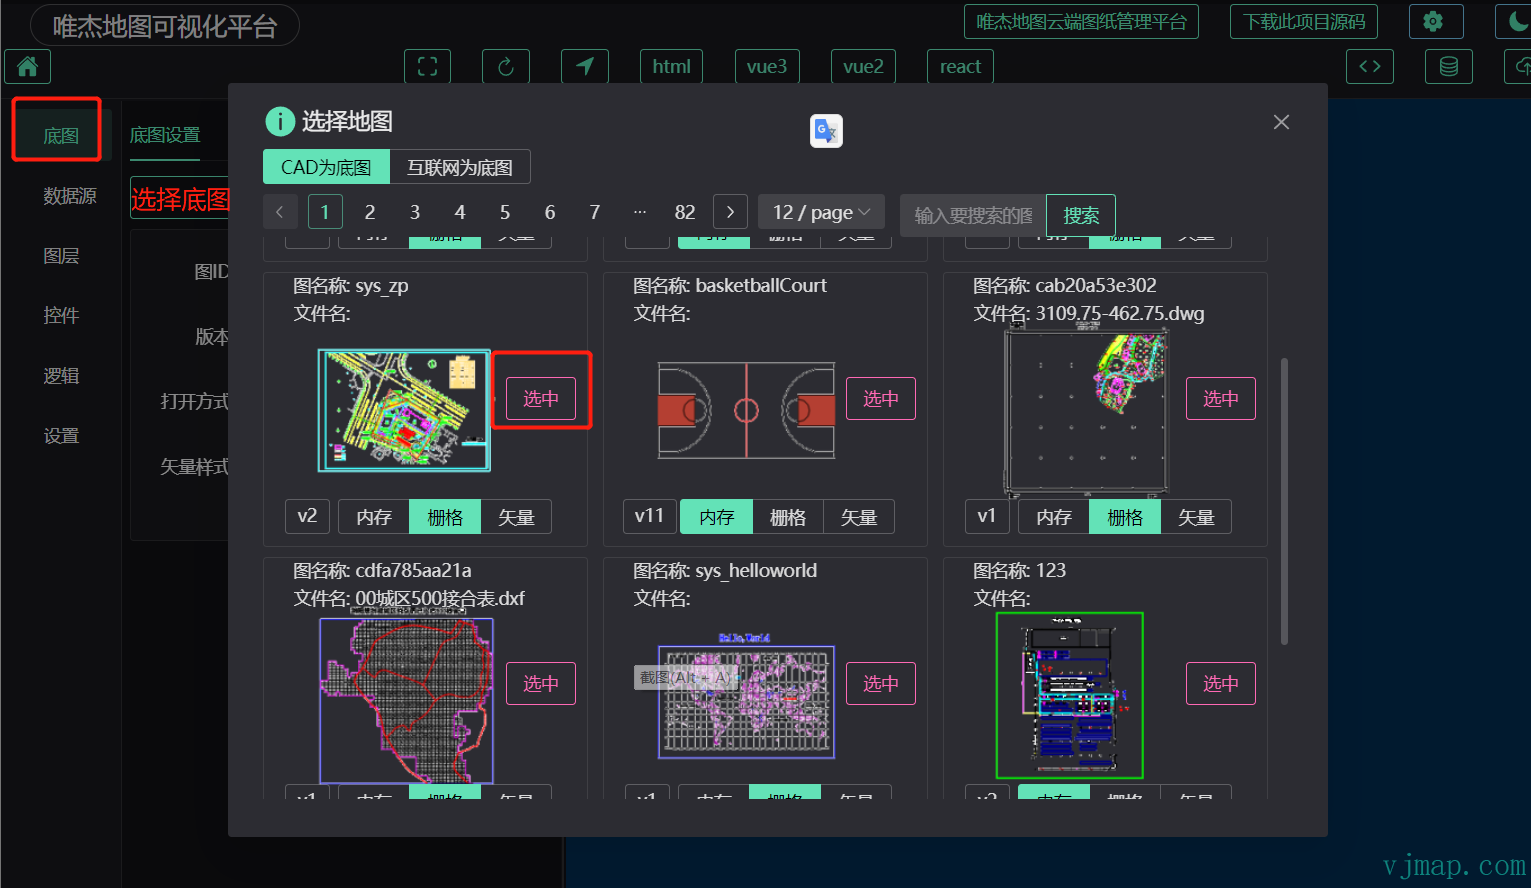
After selecting a base map, you can set the map style in Map Style and the initial display position in Map Options.
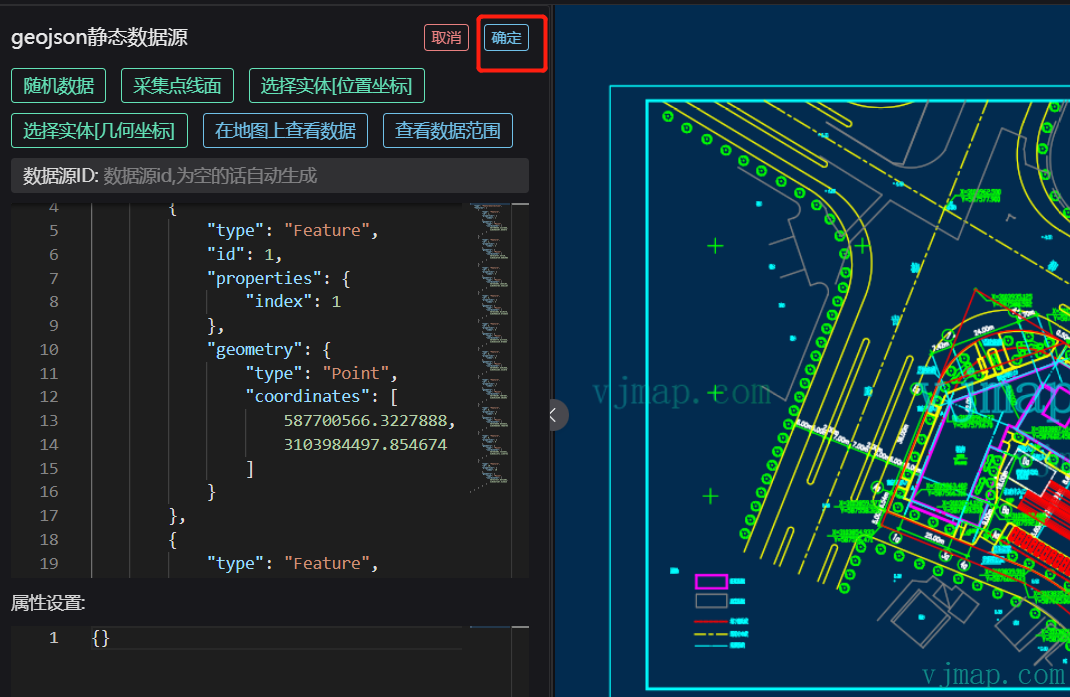
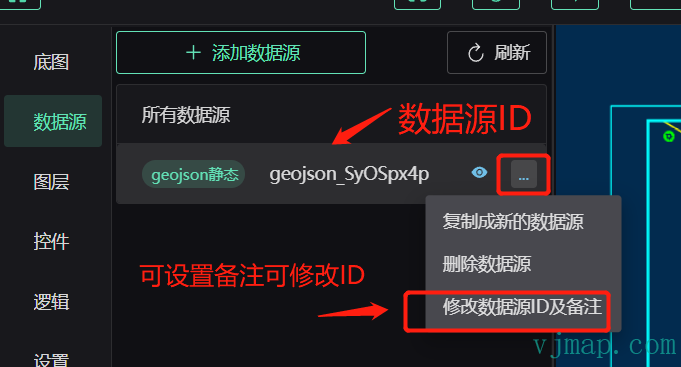
# Data Sources

- GeoJSON Data Source:
Static data: Static GeoJSON data that can be entered directly or obtained by picking on the map or randomly generated;
Graph query data: GeoJSON data obtained by querying CAD map data from the backend;
Graph drawing data: GeoJSON data obtained by drawing different shapes on the map;
Dynamic data: GeoJSON data that has been processed or periodically processed;
- WMS Data Source:
Refers to raster or vector tile URL data sources overlaid on CAD or internet maps via WMS
- Raster Tile Data Source
- Vector Tile Data Source
- Image Data Source
- Video Data Source
As an example, we select GeoJSON static data and randomly generate some GeoJSON point data
# Layers
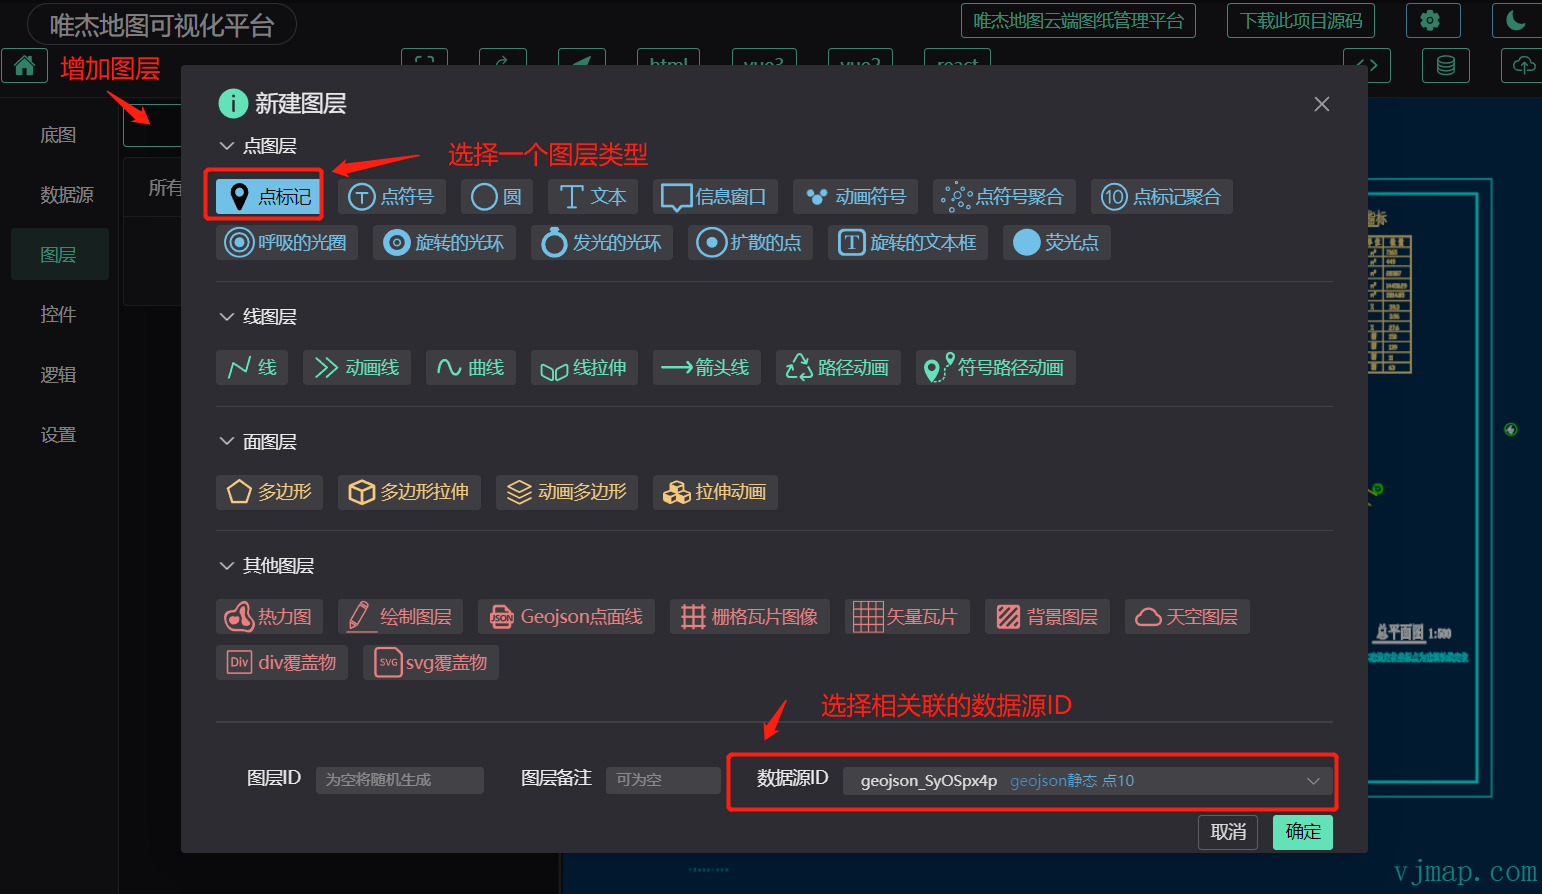
After confirming selection
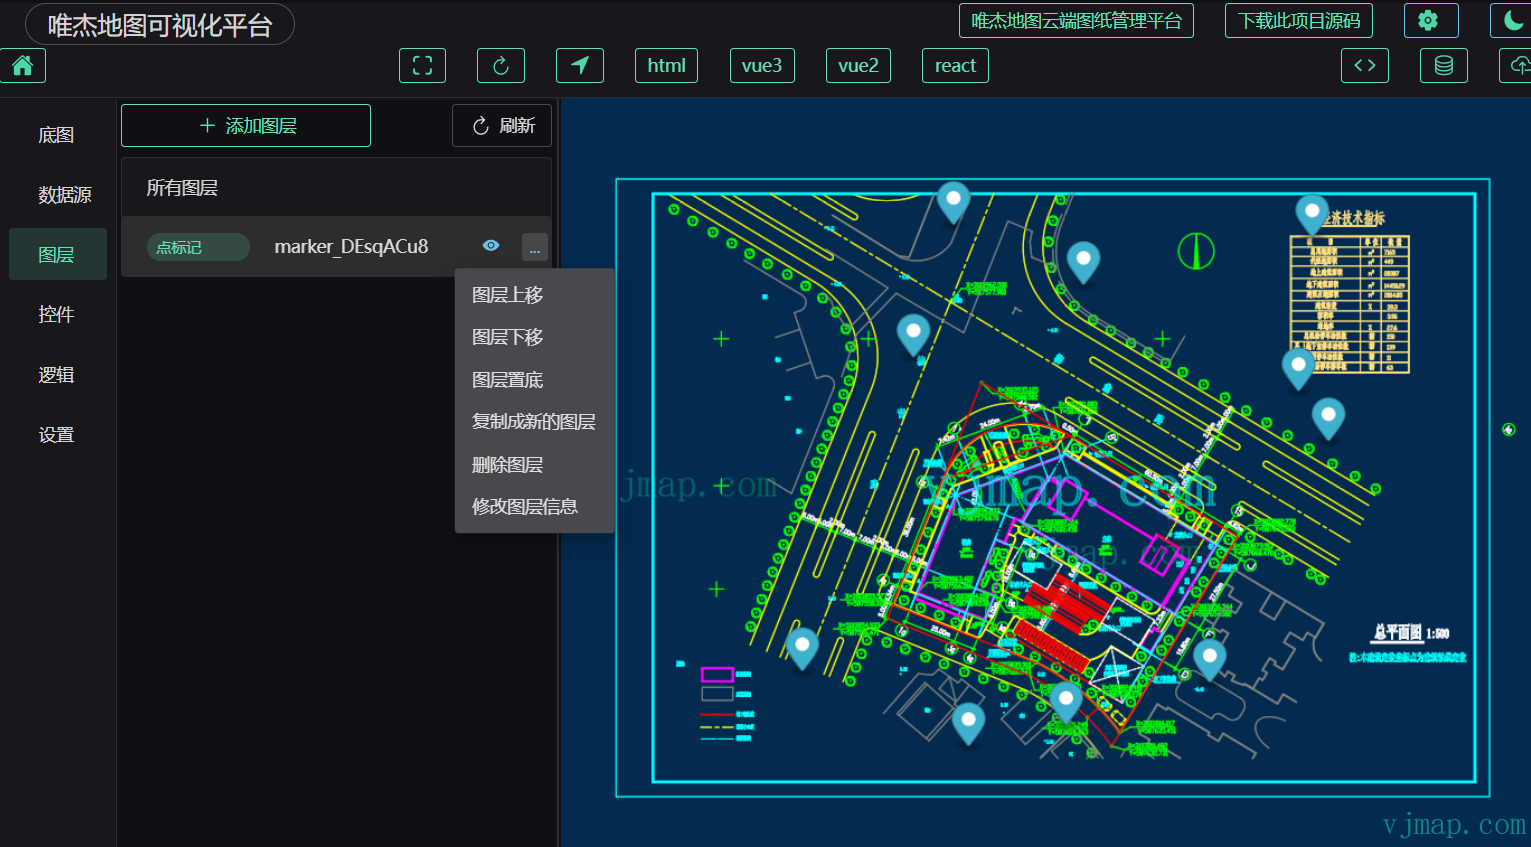
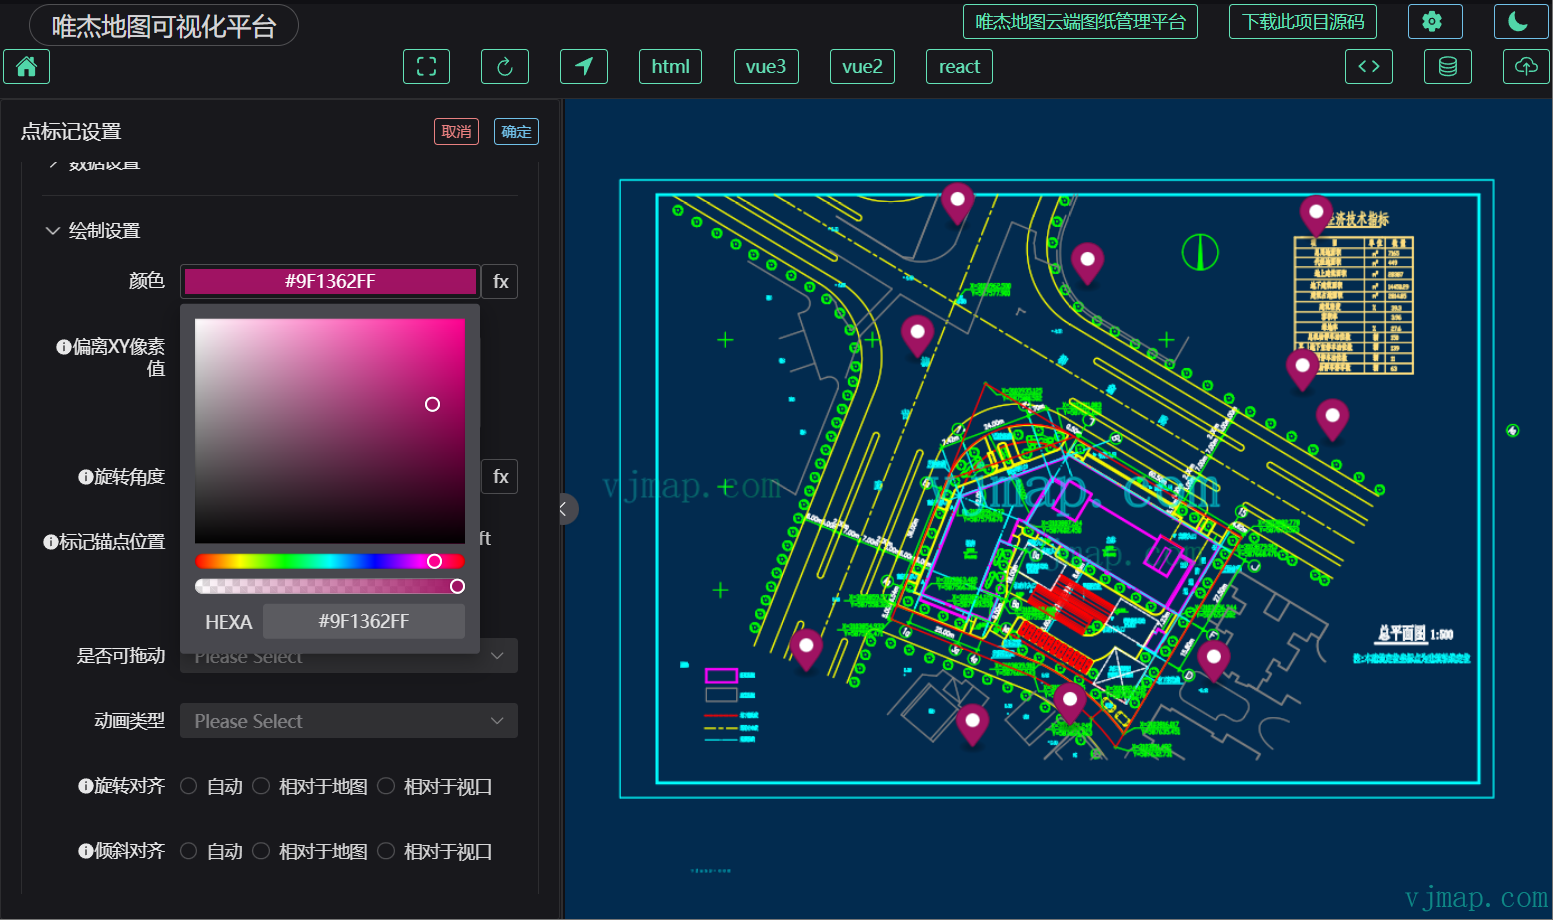
Click on a layer to enter the detailed layer settings interface
# Controls

# Logic
Some visualization logic that cannot be configured well needs to be implemented with code here
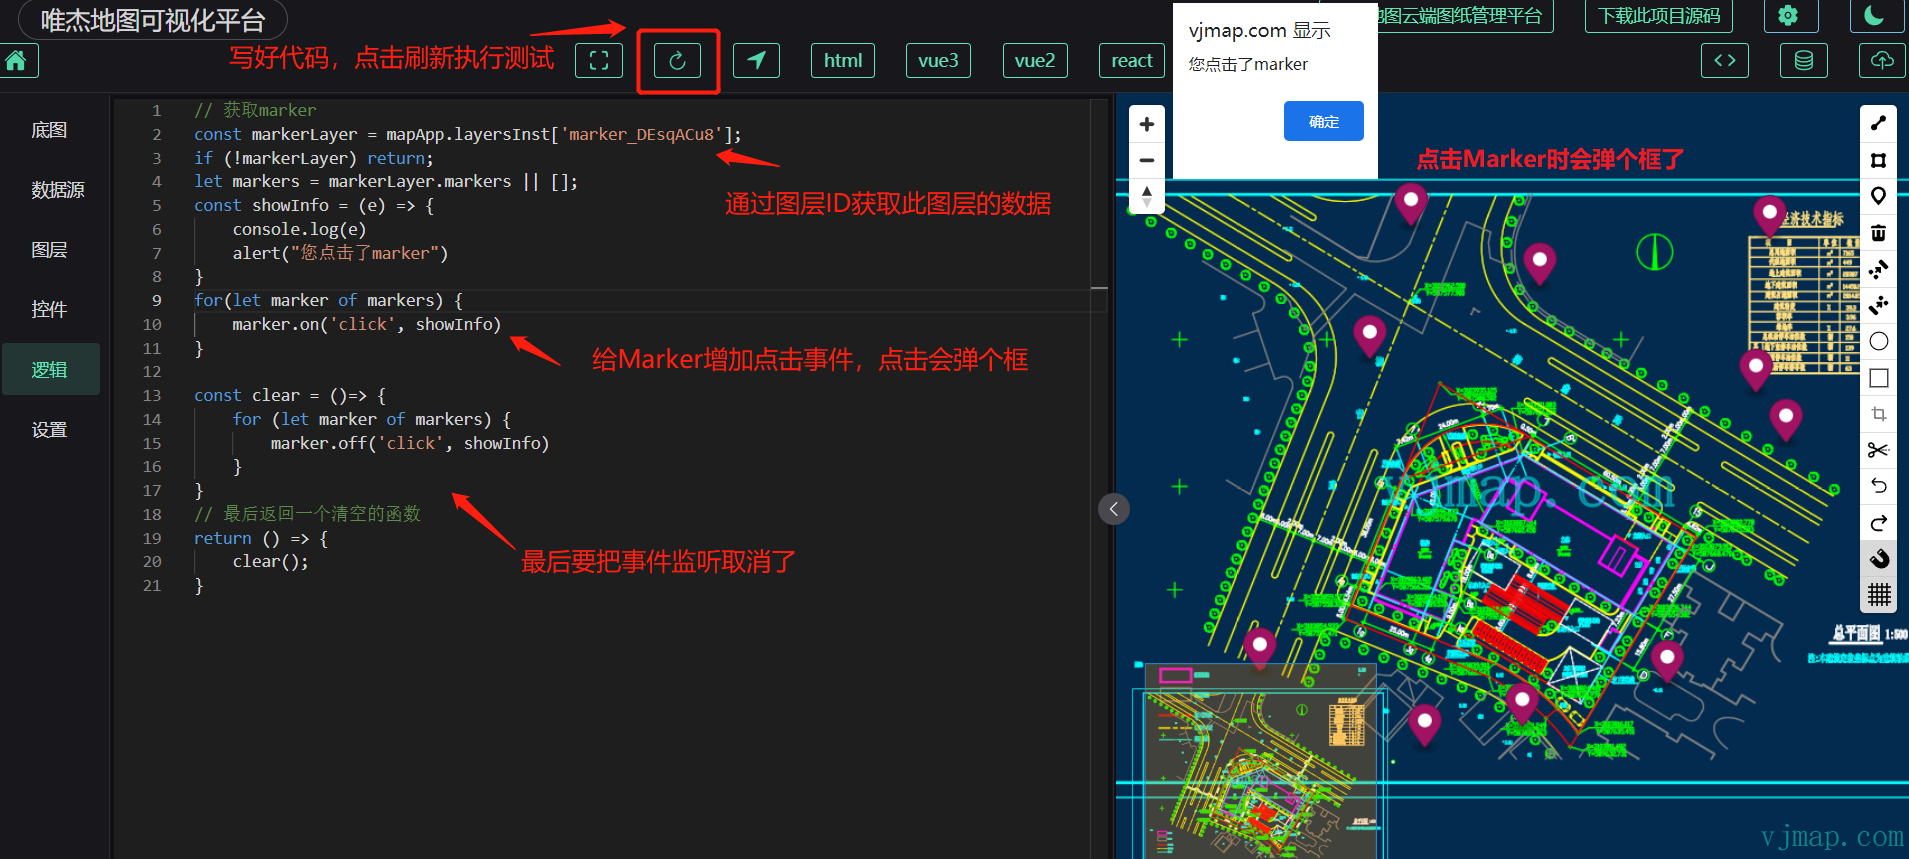
You can also download html, vue, and related code projects from the toolbar, and implement logic code in editors like VSCode for better syntax hints and debugging experience.
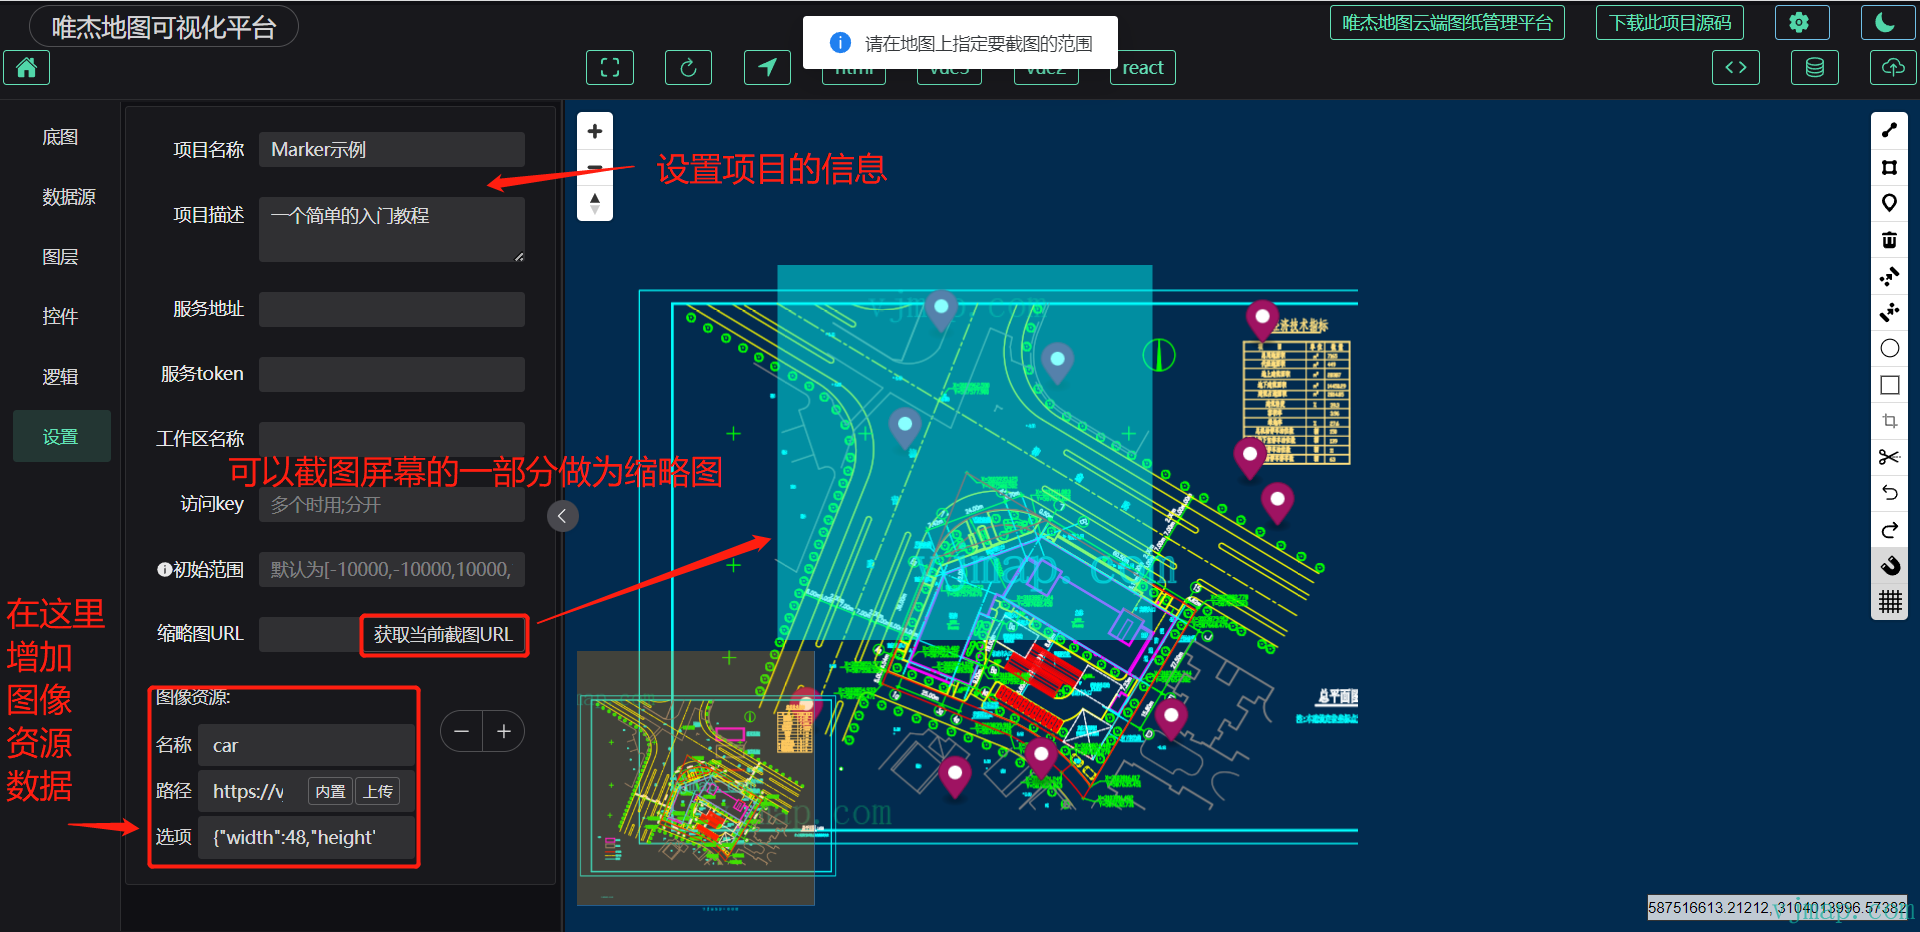
# Settings
# Publish and Export
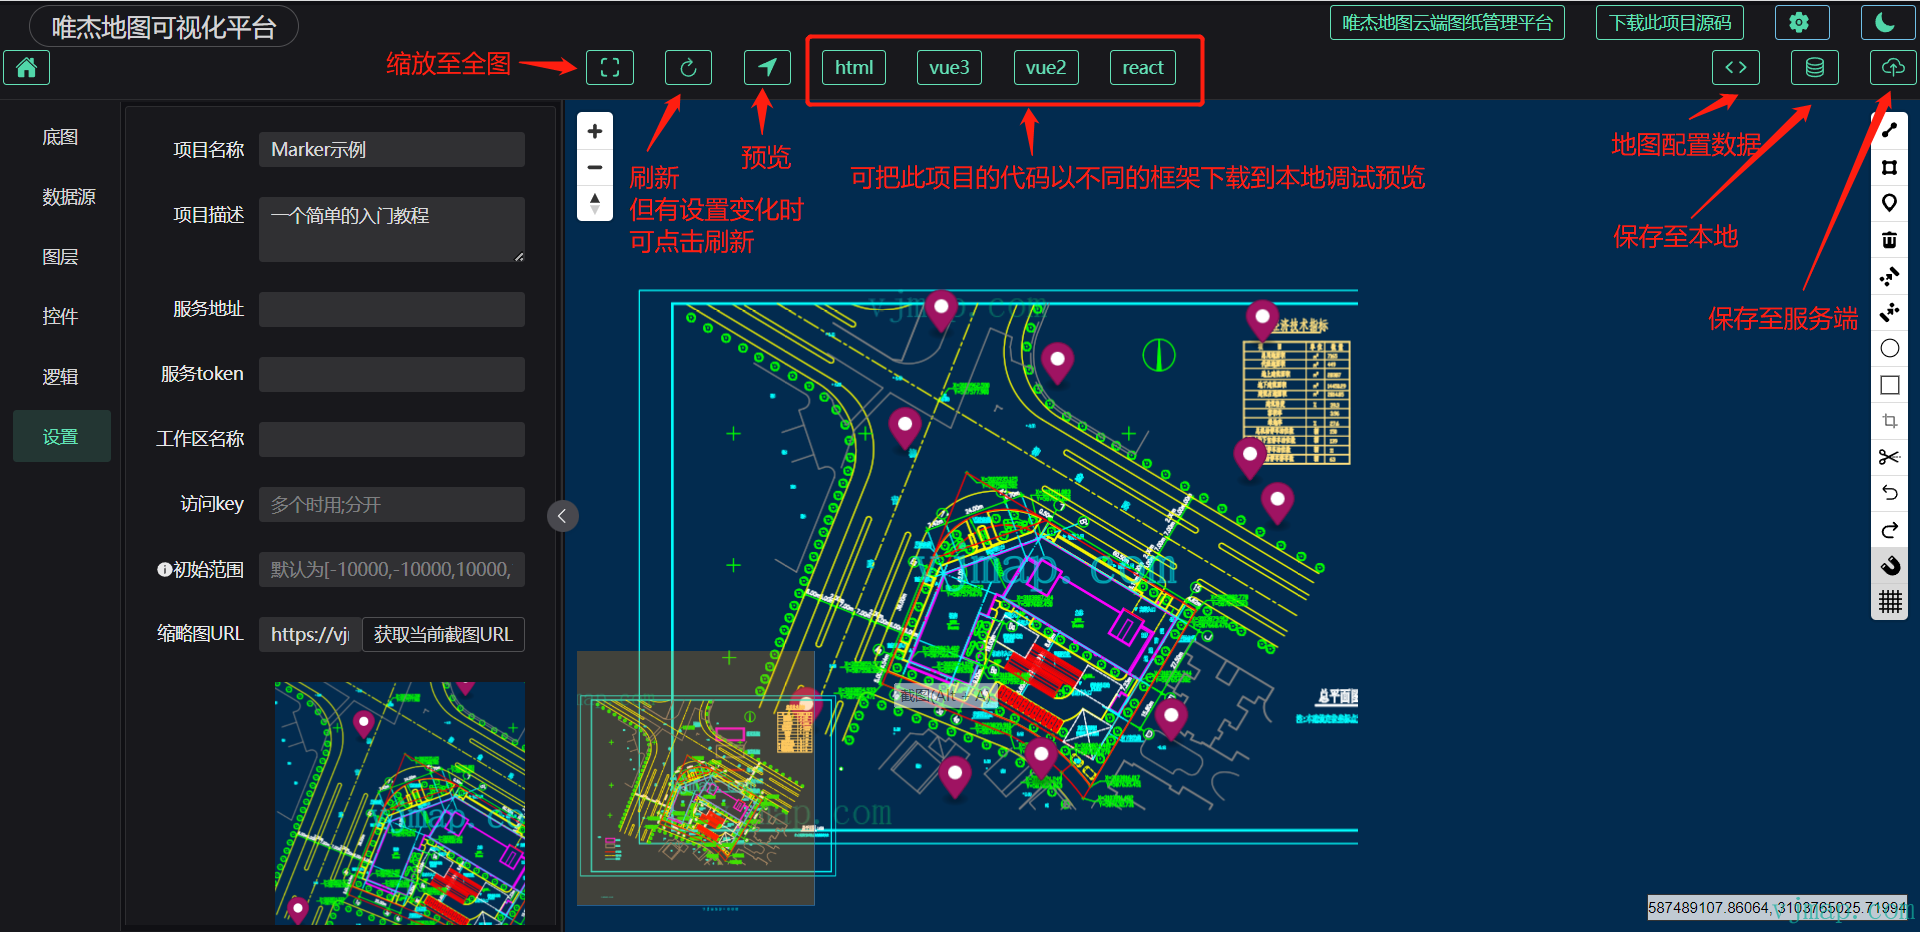
For temporary modifications, save to local. When publishing, save data to the server.
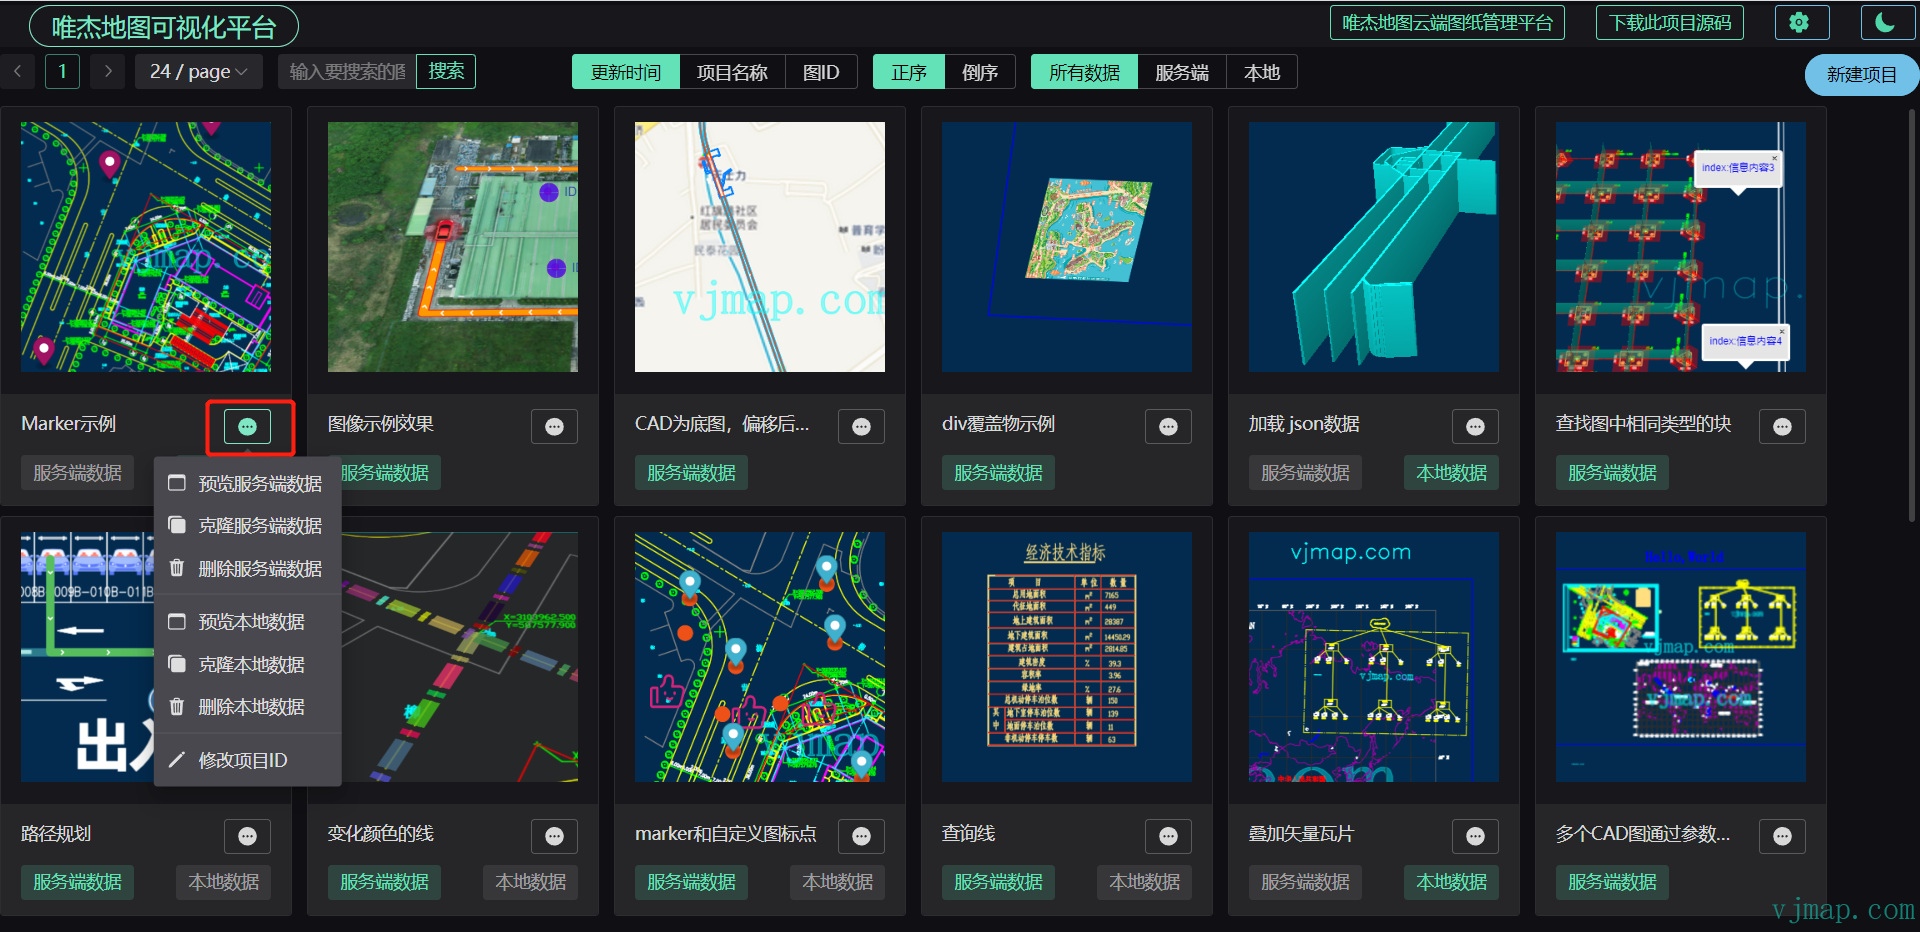
# Project Management
Return to the VJMap visualization homepage and click the action button to manage the corresponding project