# AI Draw CAD
# Generate CAD Drawings with Trae and Cursor for Free
# Sample Results
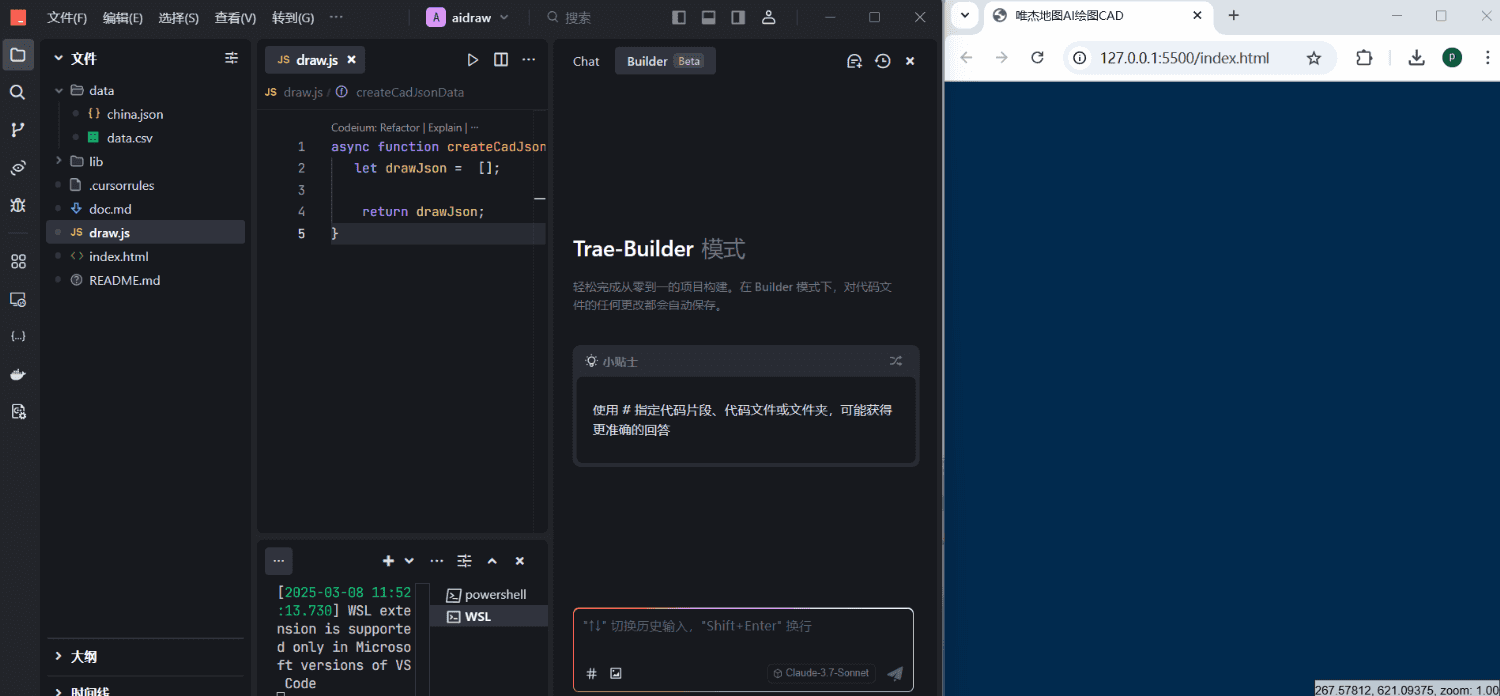
Trae Editor
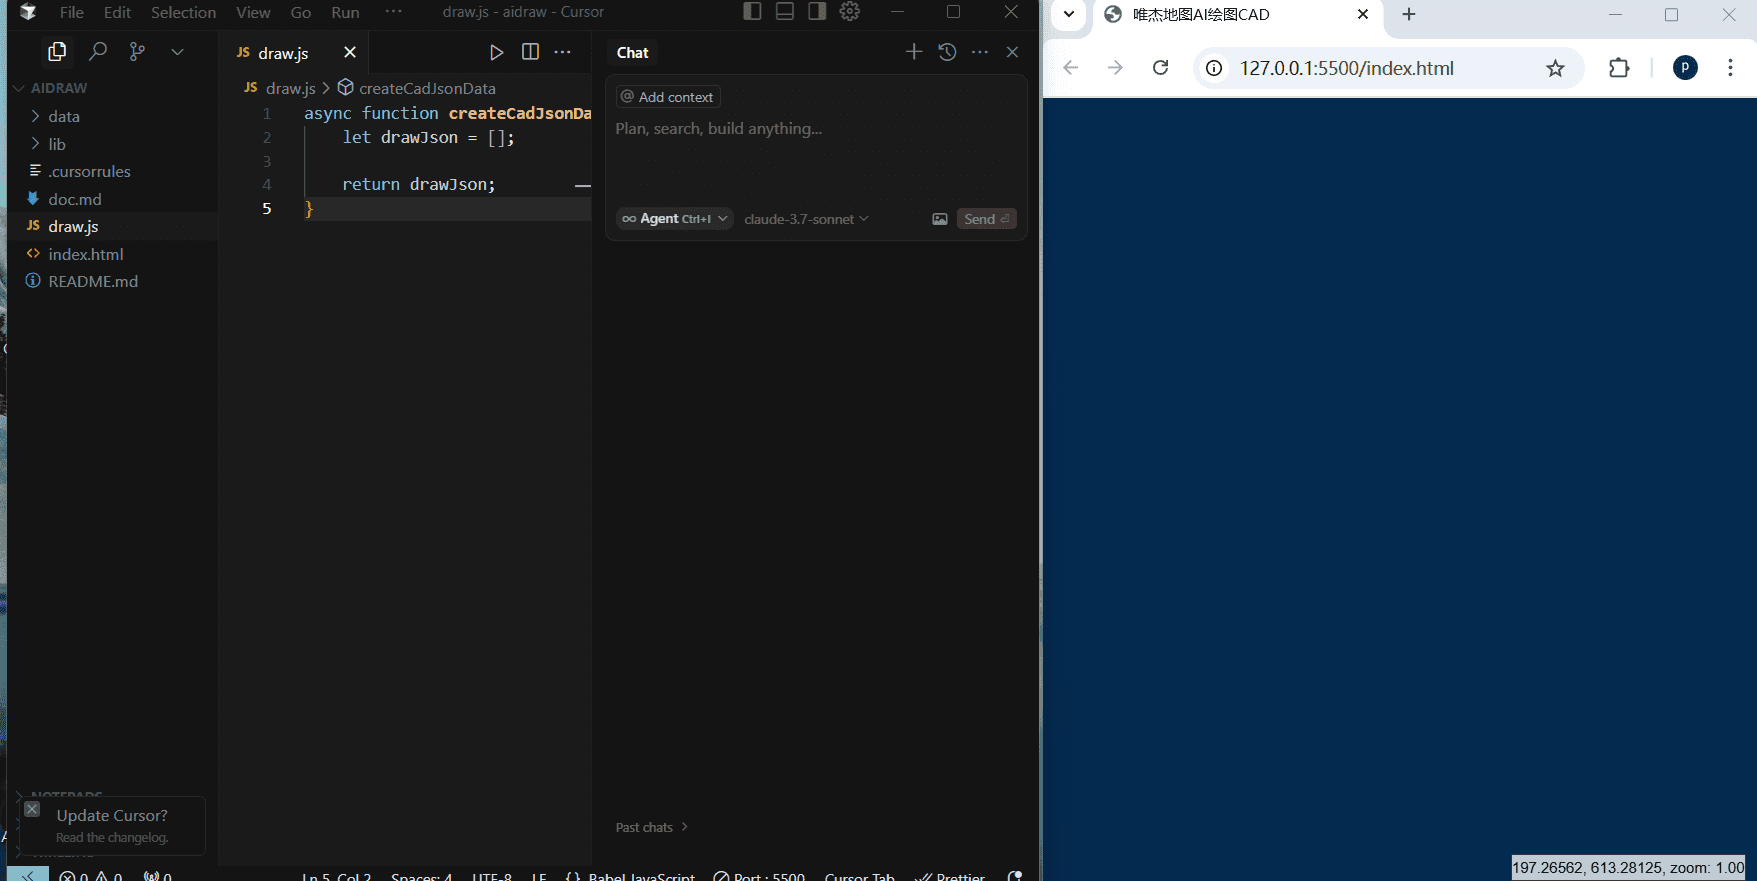
Cursor Editor
# Steps
- Download project source from GitHub https://github.com/vjmap/aidraw (opens new window)
Or download directly: https://vjmap.com/download/aidraw.zip (opens new window)
- Open the project source with
TraeorCursoreditor
- Open the project source with
- Search for
LiveServerin the extension marketplace and install (optional, or use another HTML server, ordouble-click index.htmlto open in browser [this method doesnotsupport loading local files])
- Search for
- Right-click
index.html, selectOpen with Live Serverfrom the menu
- Right-click
- In
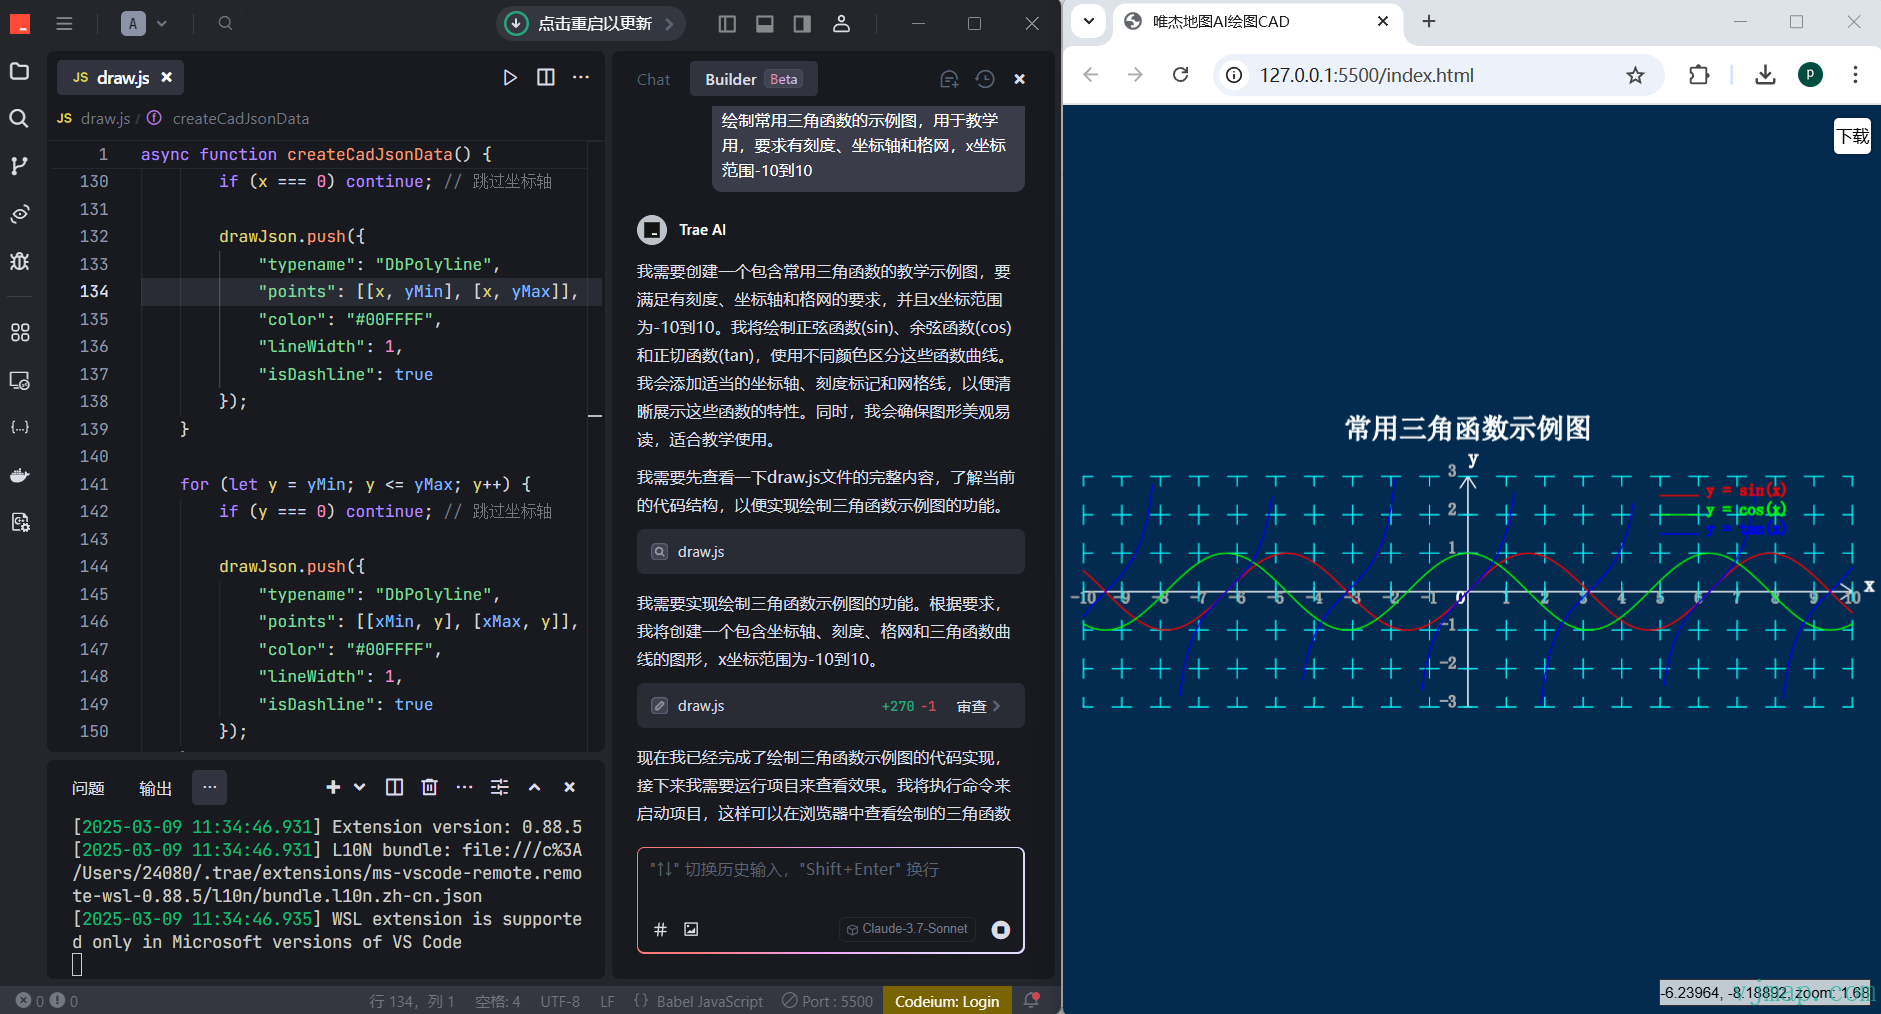
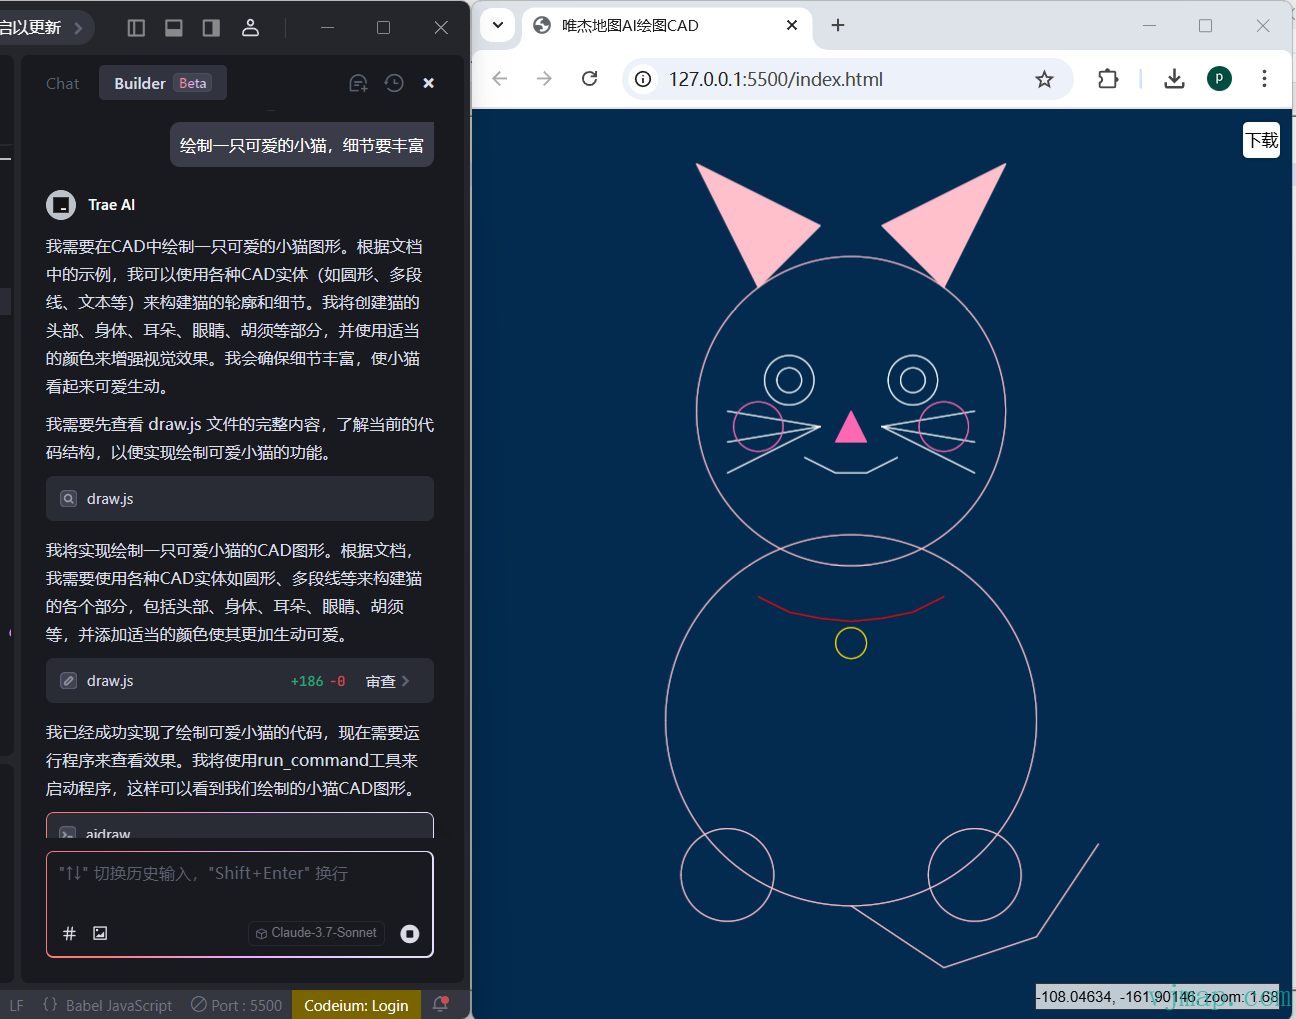
TraeenterBuildermode, or inCursorenterComposerorEditmode, then describe what you want to draw
- In
- After generation, open
draw.jsto view the output, refresh the page in the browser to see the result
- After generation, open
- Click the
Downloadbutton in the top-right of the generated page to download the generateddwgfile supported by AutoCAD
- Click the
# Tutorial Video
https://www.bilibili.com/video/BV1sRRYY2EBo/ (opens new window)
# Related Examples
Draw a sample diagram of common trigonometric functions for teaching, with scales, axes and grid, x range -10 to 10
Draw a cute cat with rich details
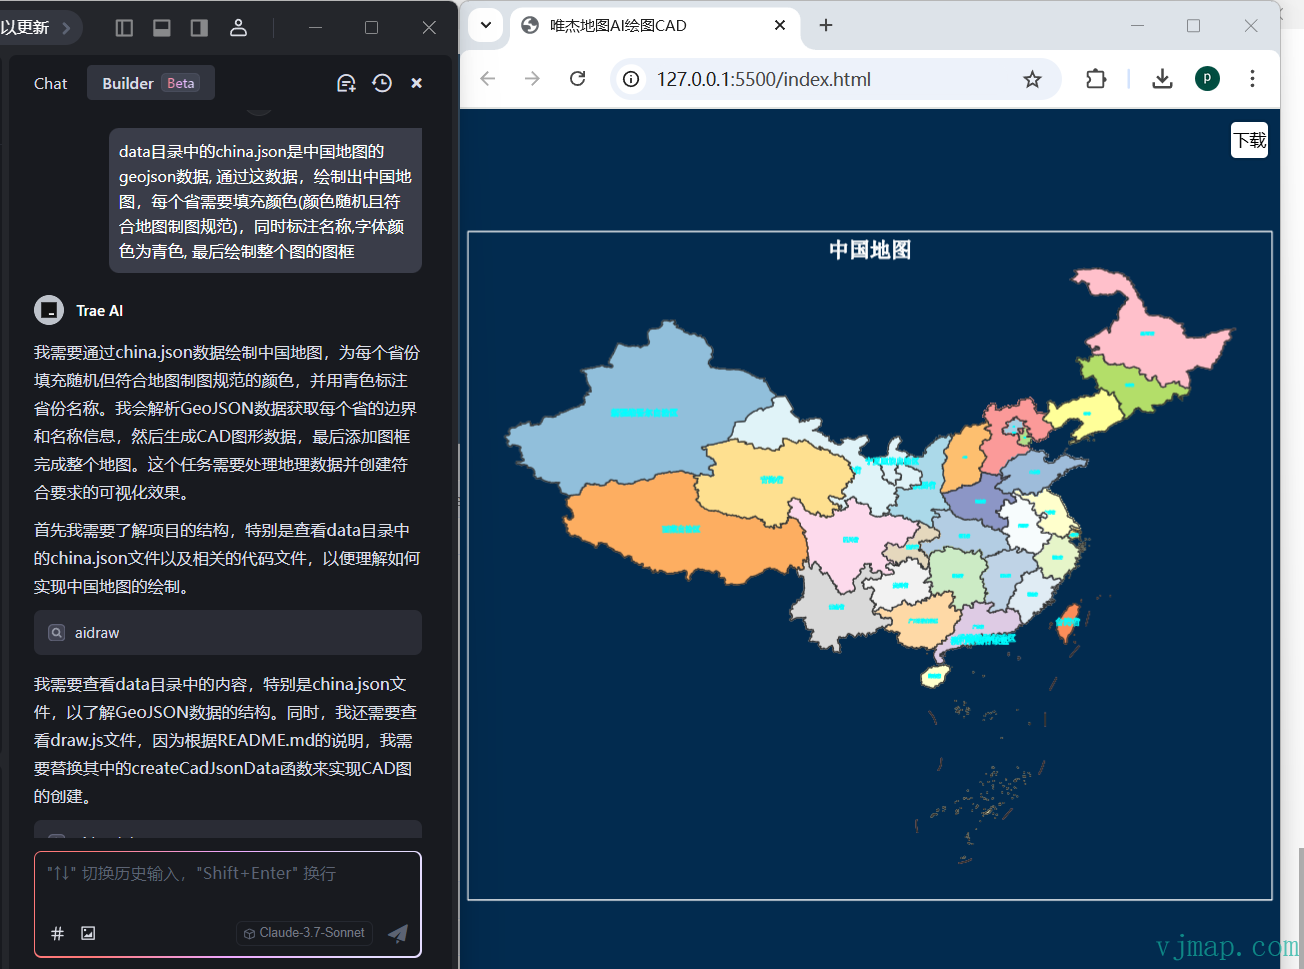
data/china.json contains China map GeoJSON. Use it to draw China, fill each province with a color (random but cartographically appropriate), label names in cyan, and draw the map frame
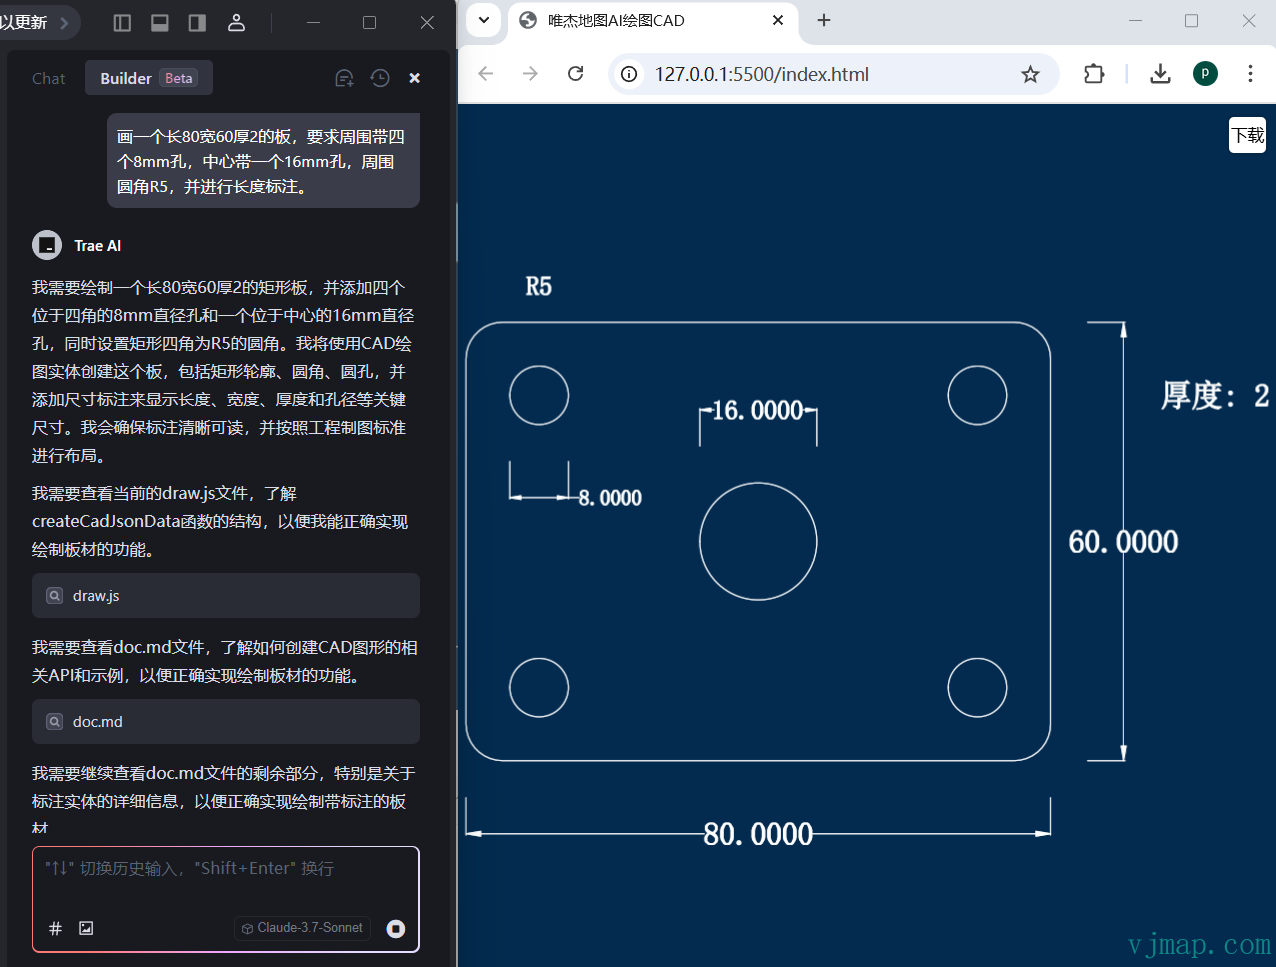
Draw a plate 80 long, 60 wide, 2 thick, with four 8mm holes around it, one 16mm hole in the center, R5 fillets, and length dimensions
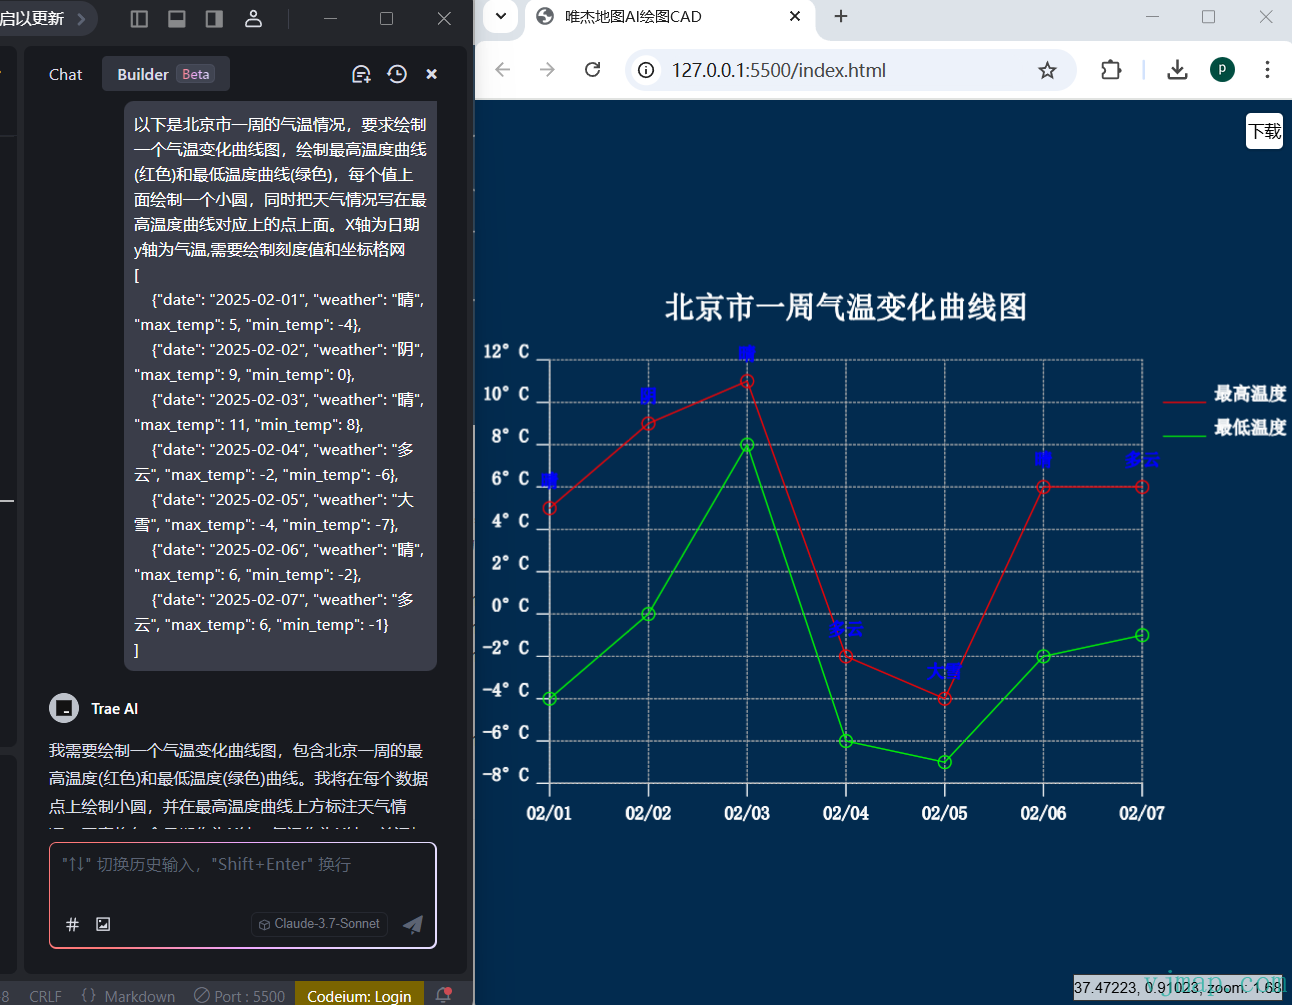
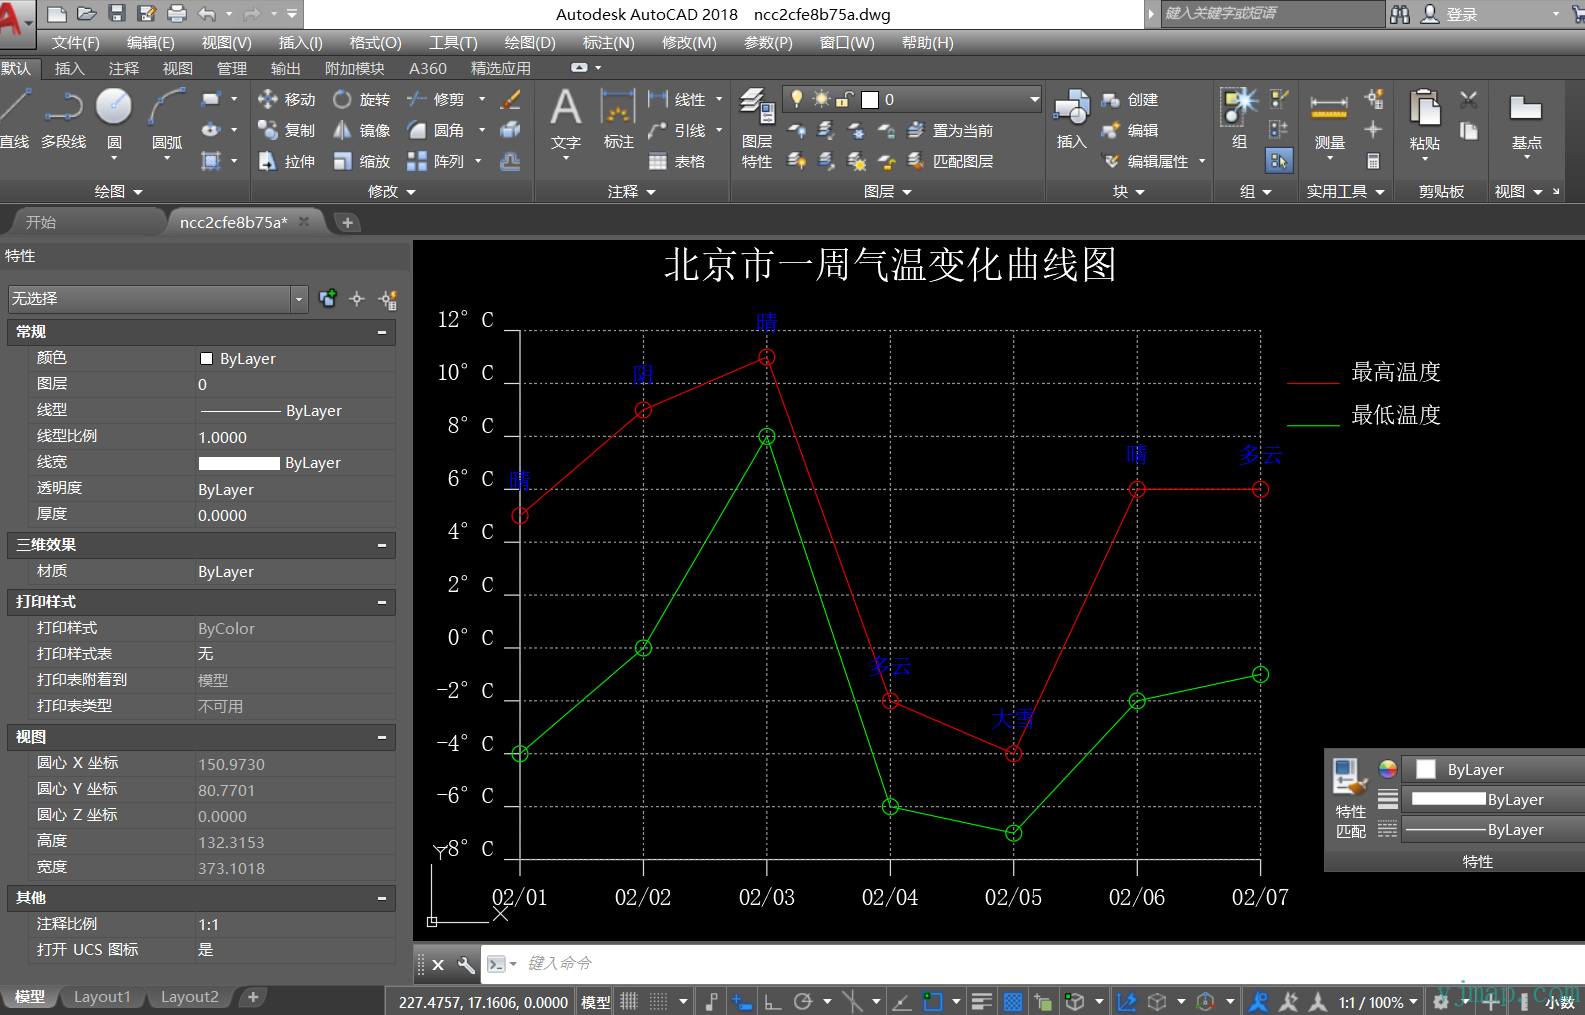
Beijing weekly temperature data. Draw a temperature curve chart with max temp (red) and min temp (green), small circles at each value, weather labels above max temp points. X-axis: date, Y-axis: temperature, with scale values and grid
[
    {"date": "2025-02-01", "weather": "Sunny", "max_temp": 5, "min_temp": -4},
    {"date": "2025-02-02", "weather": "Cloudy", "max_temp": 9, "min_temp": 0},
    {"date": "2025-02-03", "weather": "Sunny", "max_temp": 11, "min_temp": 8},
    {"date": "2025-02-04", "weather": "Overcast", "max_temp": -2, "min_temp": -6},
    {"date": "2025-02-05", "weather": "Heavy snow", "max_temp": -4, "min_temp": -7},
    {"date": "2025-02-06", "weather": "Sunny", "max_temp": 6, "min_temp": -2},
    {"date": "2025-02-07", "weather": "Overcast", "max_temp": 6, "min_temp": -1}
]
2
3
4
5
6
7
8
9
10
Click Download on the generated drawing to download the dwg file and open it in AutoCAD
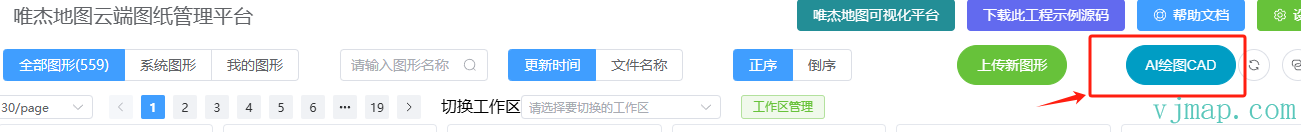
# VJMap AI Draw CAD Usage
Go to VJMap Cloud Management Platform (opens new window), click AI Draw CAD on the right
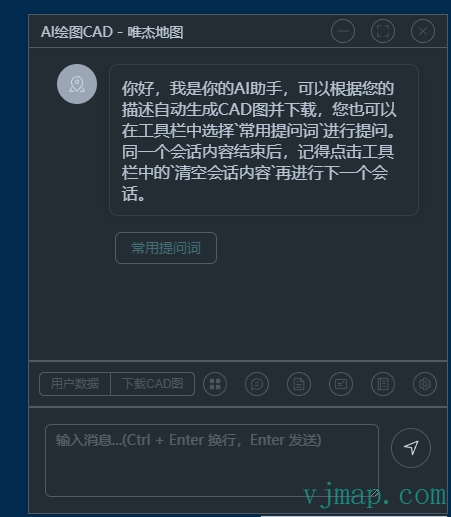
Video tutorial: https://www.bilibili.com/video/BV1g19BYNECf/ (opens new window)
# Drawing
# 1. Draw from Description
Enter a description of what to draw in the input box and click Send
AI generates code based on the description
Code runs automatically (or manually) to produce the CAD drawing
Click to download the generated DWG
Example input:
Draw a cute cat with rich details1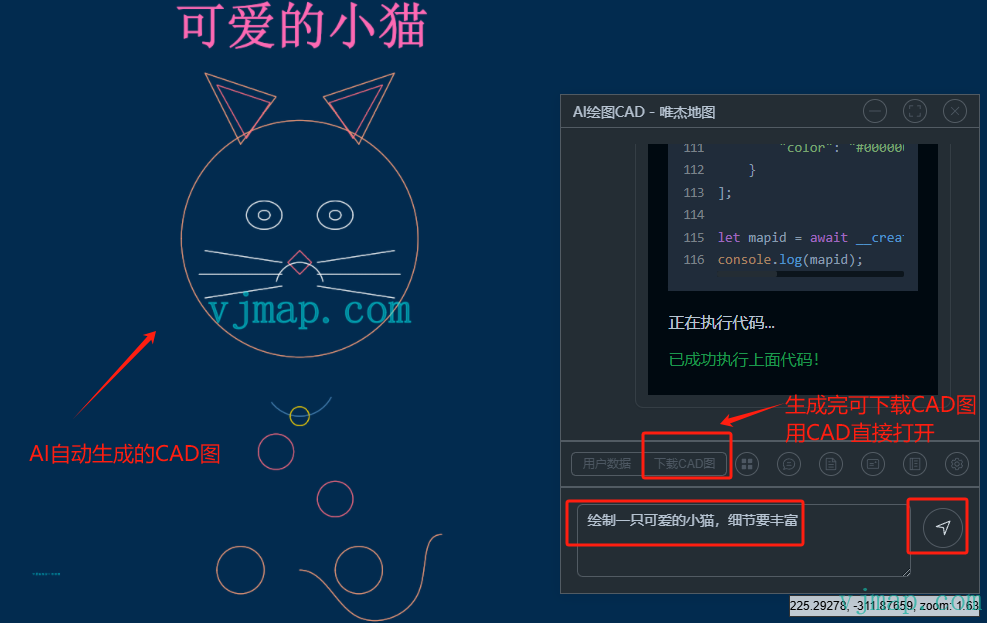
Note: Set the model URL and name in Settings. Different models produce different results. This example used
claude 3.7 sonnet
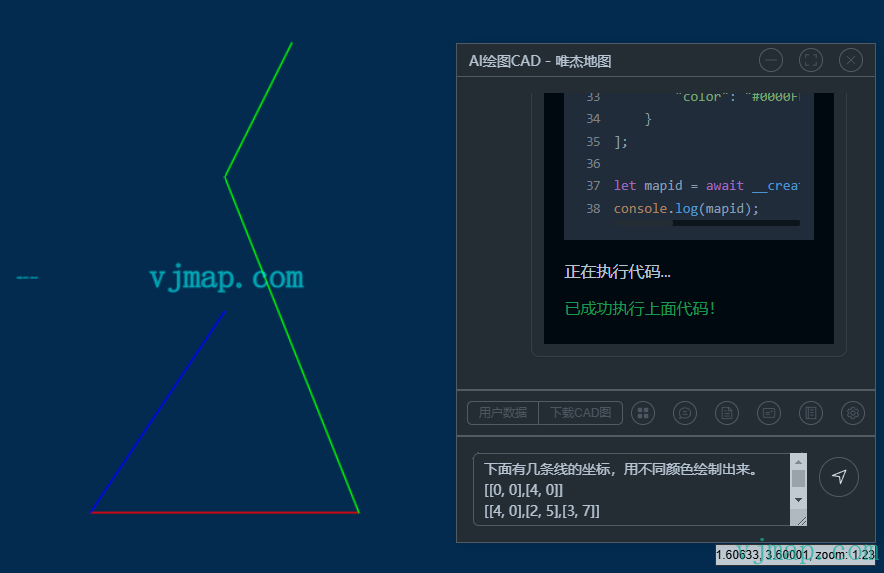
# 2. Draw from Direct Data
When there is little data, you can include it directly in the prompt
Example:
Draw these lines in different colors.
[[0, 0],[4, 0]]
[[4, 0],[2, 5],[3, 7]]
[[2, 3],[0, 0]]
2
3
4
# 3. Draw from User Data
When there is lots of data, because of model context limits and token cost, first click User Data and paste the data there so the code can read it at runtime. Note: the model does not know the data format, so describe the format clearly in the prompt.
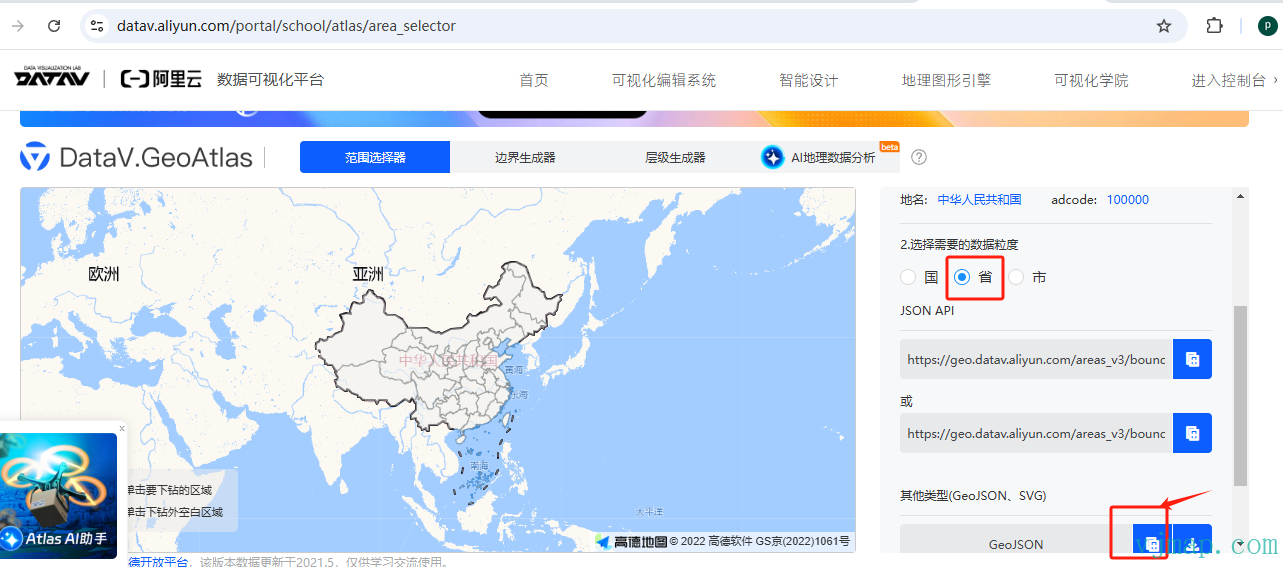
Example: for a China map, go to Alibaba Data Visualization Platform (opens new window), select province data, click Copy GeoJSON
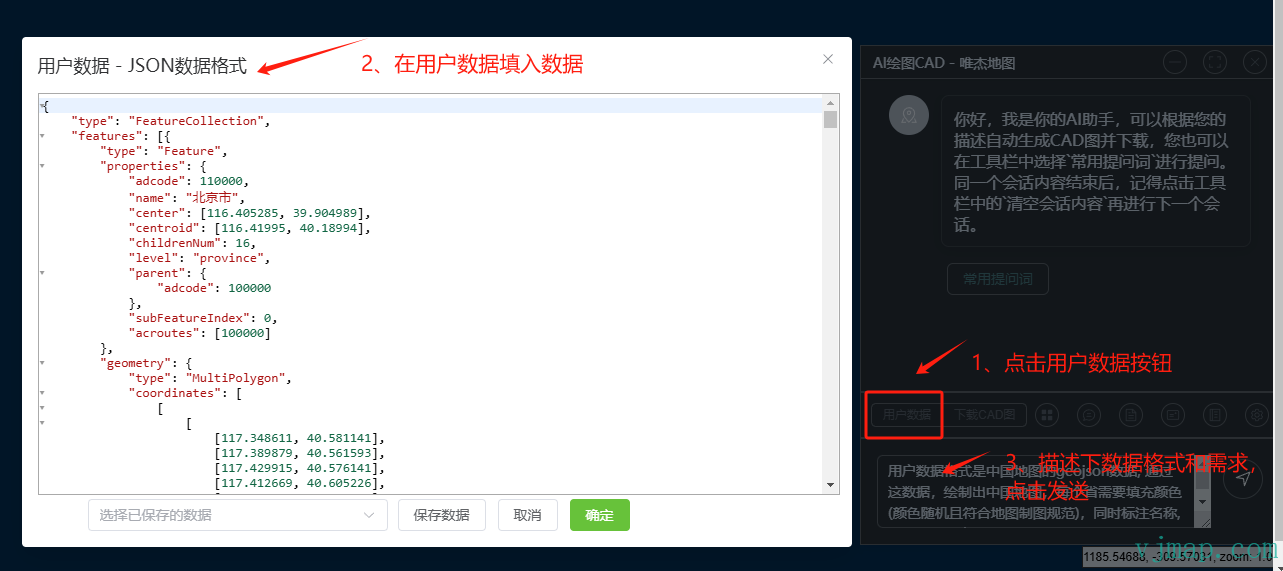
User data is China map GeoJSON. Use it to draw China, fill each province with a color (random but cartographically appropriate), label names in cyan, and draw the map frame
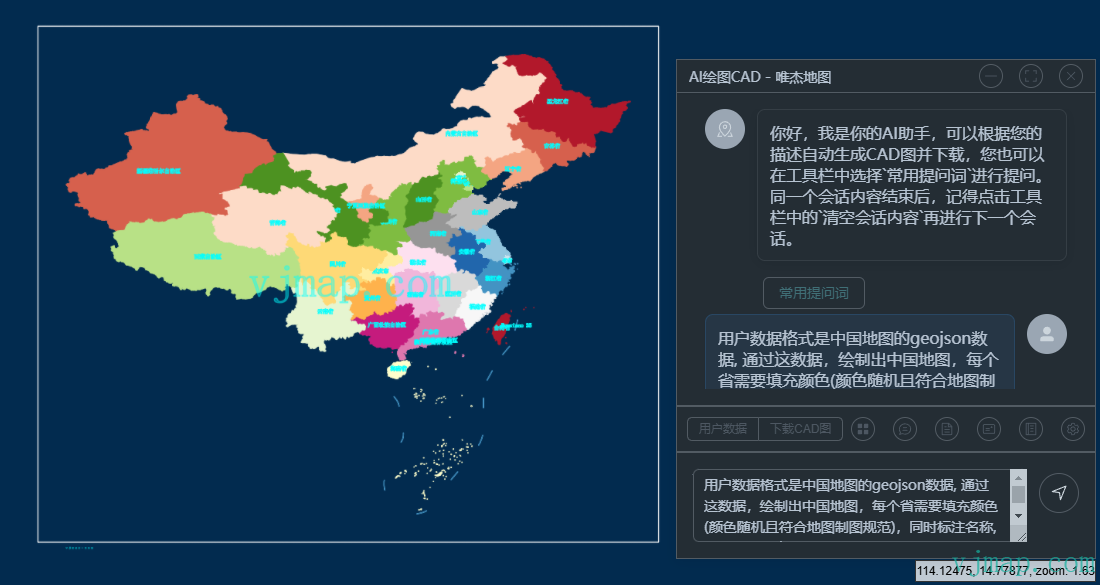
Note: This example used claude 3.7 sonnet
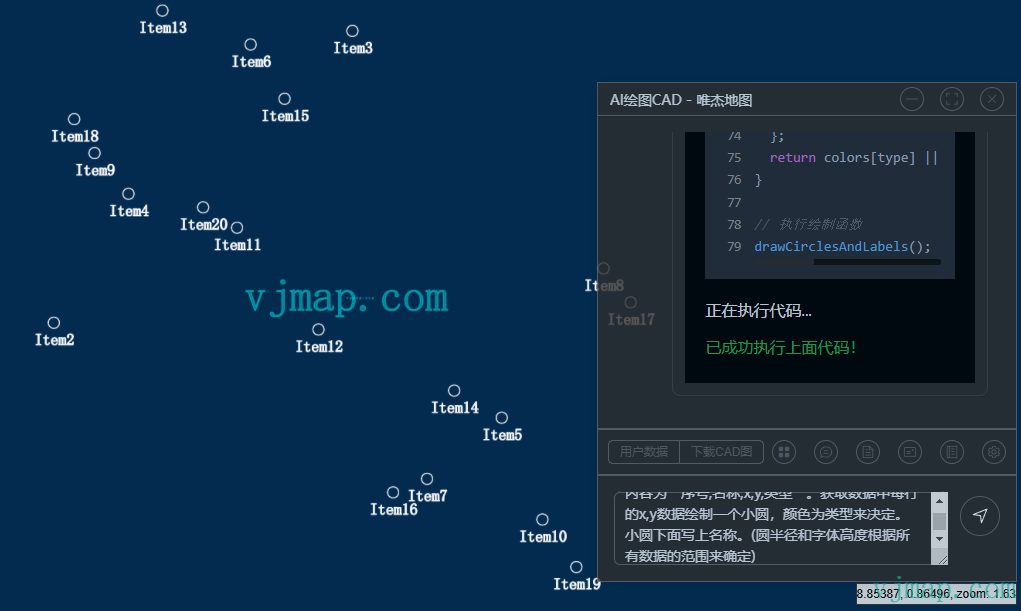
GeoJSON is common; just say the user data is GeoJSON. For other formats, describe the structure. Example CSV:
1,Item1,3.5,7.2,A
2,Item2,1.2,4.8,B
3,Item3,5.6,9.1,C
4,Item4,2.3,6.7,A
2
3
4
Describe each field and the requirements:
User data is CSV. Each row: "index,name,x,y,type". Draw a small circle at each row's x,y. Color by type. Label name below circle. Circle radius and font height based on data extent.
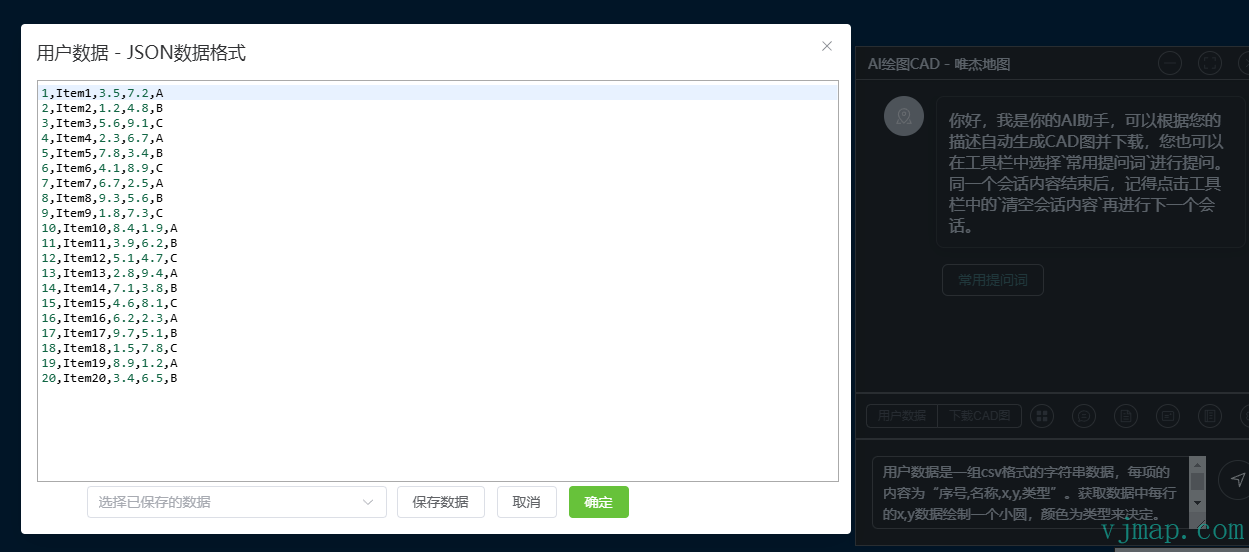
Note: This example used qwen-coder-plus-latest
# 4. Reference Entities from Other CAD Drawings
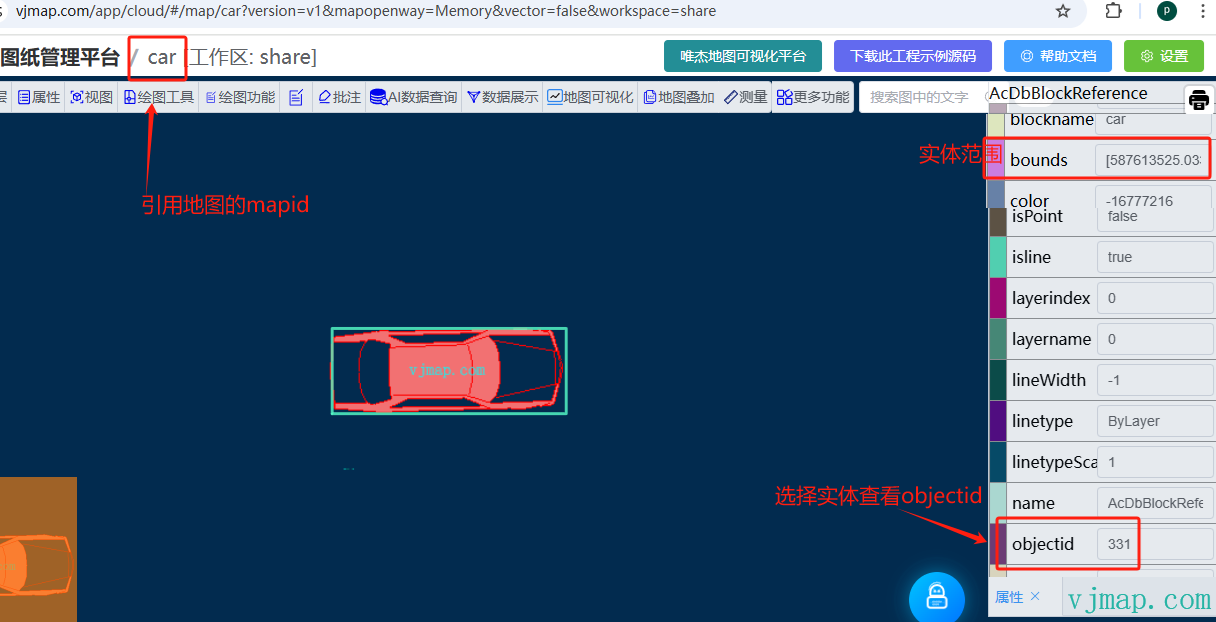
For complex symbols or symbols that already exist in another drawing, you can reference CAD entities.
First upload the CAD template to VJMap Cloud Management Platform (opens new window) (give it a mapid), open it with Memory mode, click the entity to reference, and get its objectid from the property panel on the right
Example:
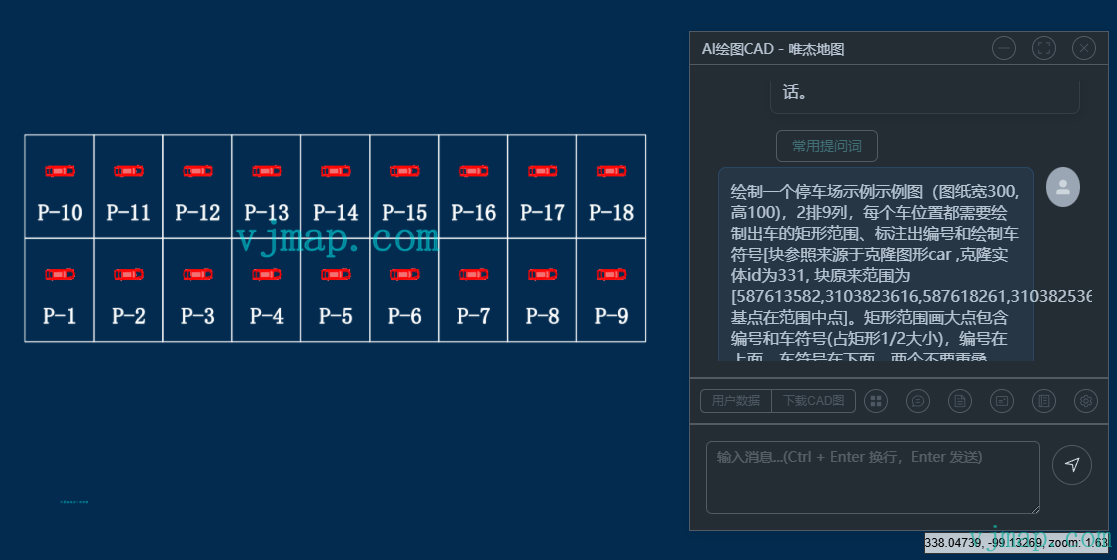
Draw a parking lot example (drawing 300 wide, 100 high), 2 rows 9 columns. Each space: rectangle, label, and car symbol [block reference from map car, entity id 331, block bounds [587613582,3103823616,587618261,3103825364], base at center]. Rectangle large enough for label and symbol (symbol 1/2 size). Label above, symbol below, no overlap.
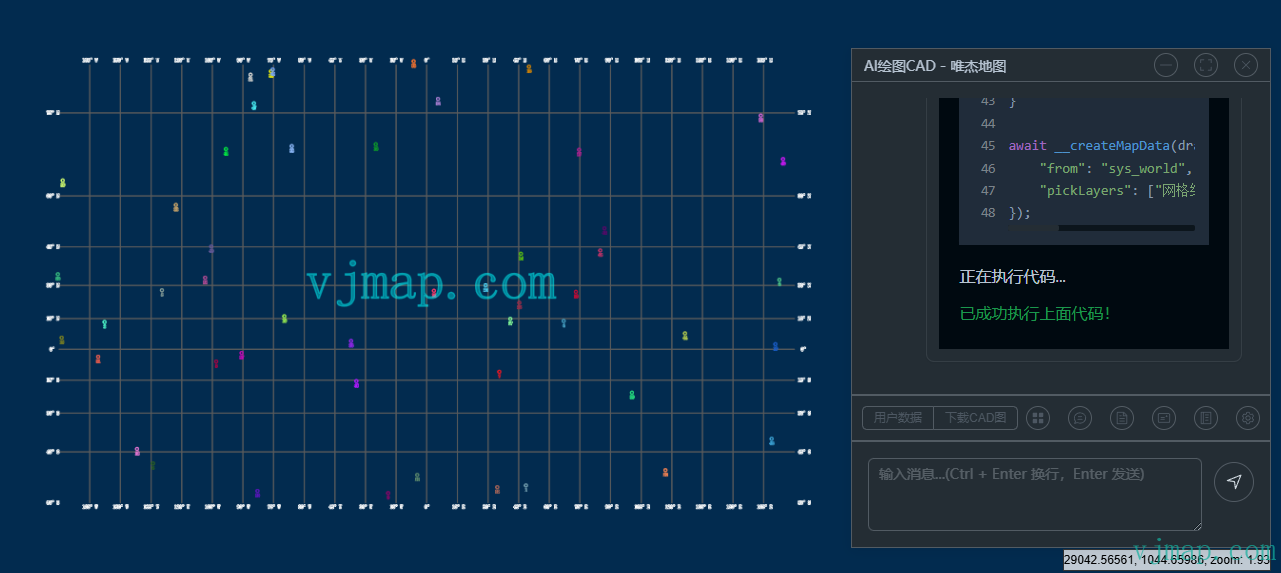
# 5. Reference Other CAD Maps or Layer Data
You can also reference entire CAD maps or specific layers. Example: sys_world layers grid and latlon labels:
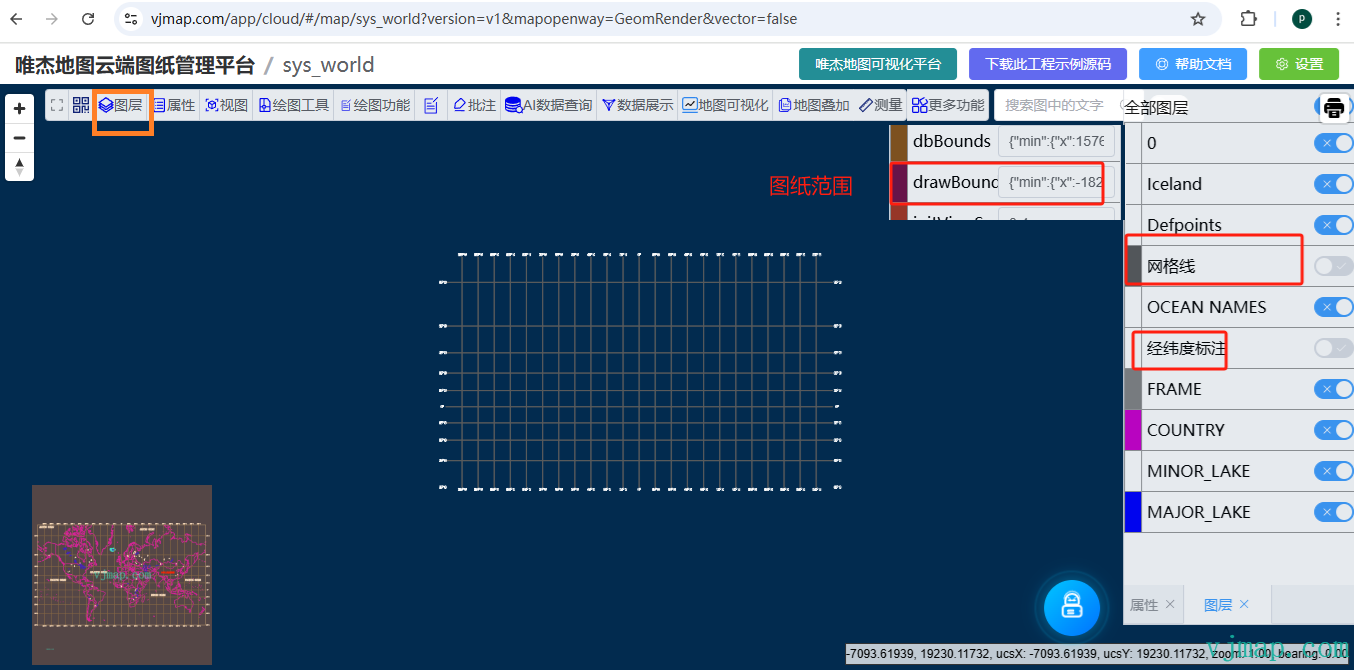
Based on map sys_world, select "grid" and "latlon labels". Drawing extent {"min":{"x":1756,"y":2537},"max":{"x":27713,"y":17957}}. Draw 50 random small circles in different colors, label index below each.
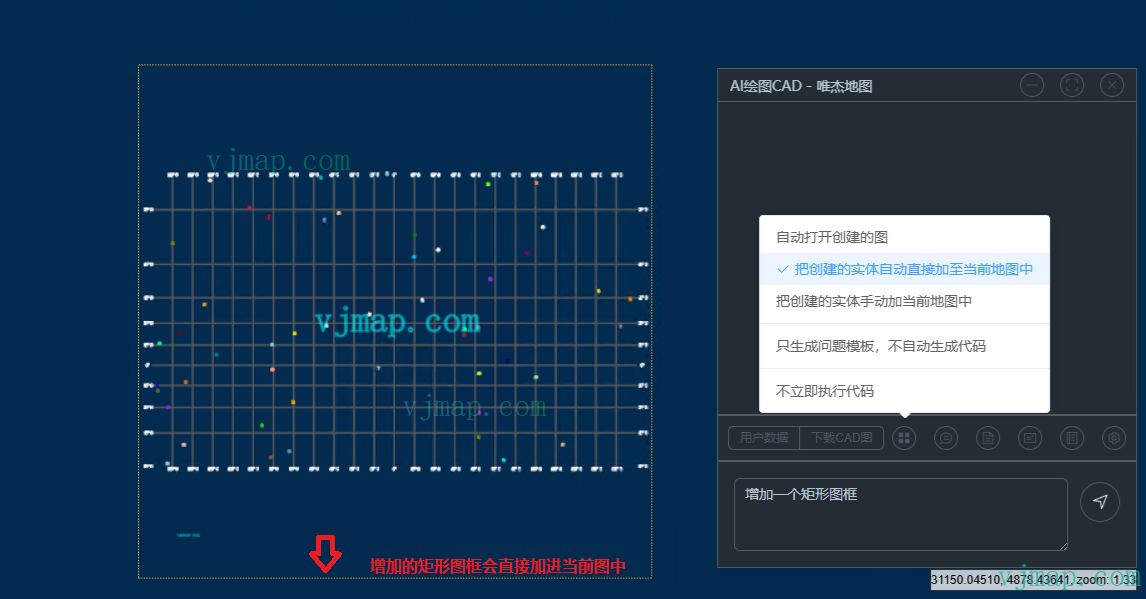
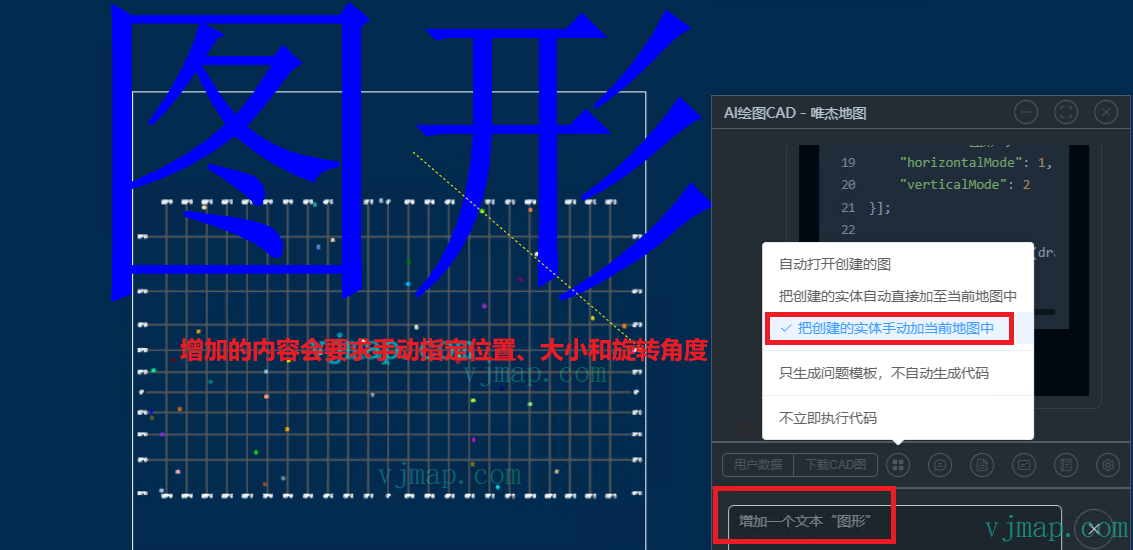
# Generation Modes
# 1. Create New Drawing
By default each creation opens a new drawing
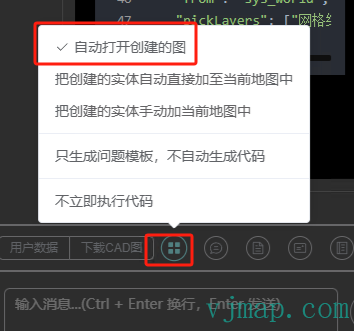
# 2. Append to Current Drawing
To add data to the current drawing, choose Append created entities to current map
# 3. Interactive Manual Append
# Download Generated CAD
After generation, click Download CAD in the toolbar to download the dwg file. Open with AutoCAD to view.
For private deployment, configure the backend for download due to data security.
Open config.json in the data directory. Under the system key set the download path mapping, and in usercfg set shareWorkspace (workspace for drawing, empty for default) and shareDownload (download path key in token_router_static). Example:
{
	"system" : {
	  "token_router_static": "_download_cad::./data/workspace/share/mapfiles"
	},
   "usercfg": {
    "shareWorkspace": "share",
    "shareDownload": "_download_cad"
  }
}
2
3
4
5
6
7
8
9
# Settings
# Clear Session
Chat history (default 5 messages) is sent as context. When the drawing task changes, clear the session (equivalent to starting a new session).
# Online Model API Settings
Models can be configured in the backend or by users in the frontend.
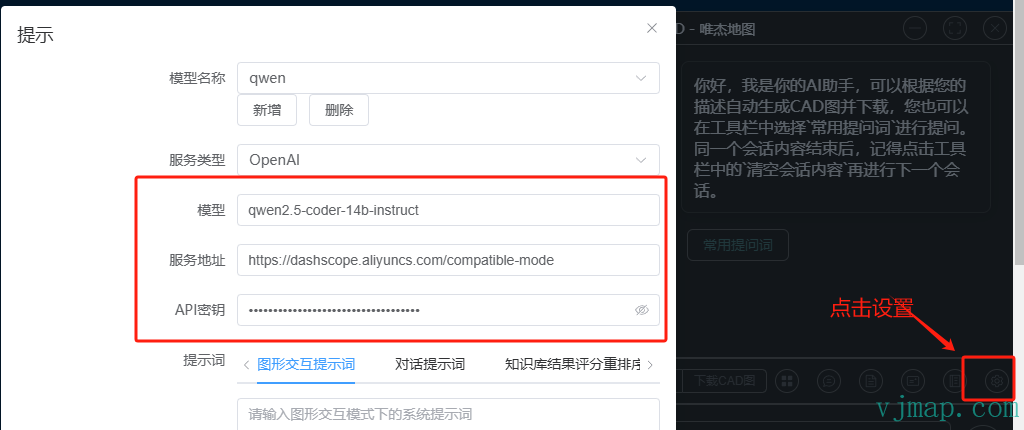
More settings: https://vjmap.com/guide/aichat.html (opens new window)
# Using Free Online Models (e.g. DeepSeek) to Generate Drawings
Online API calls consume tokens and cost money. This method uses free online AI sites to generate code:
- In Settings, enable "Only generate prompt template, do not auto-generate code"
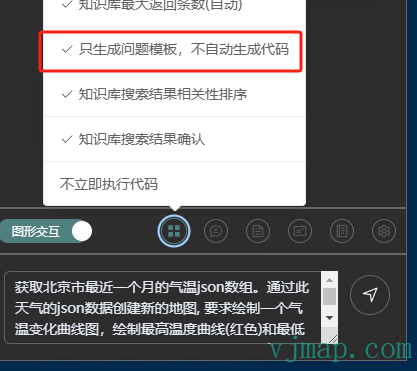
- In Settings, enable "Only generate prompt template, do not auto-generate code"
- Enter your question in the input area, e.g.
Get Beijing weather JSON for the last month. Create a new map from this data. Draw a temperature curve chart with max temp (red) and min temp (green), and weather labels above max temp points. X-axis: date (with scales), Y-axis: temperature (with scales, min -20, max 40, step 5)
- Click Send. In the "AI Question" dialog, click "Copy" to copy the question.
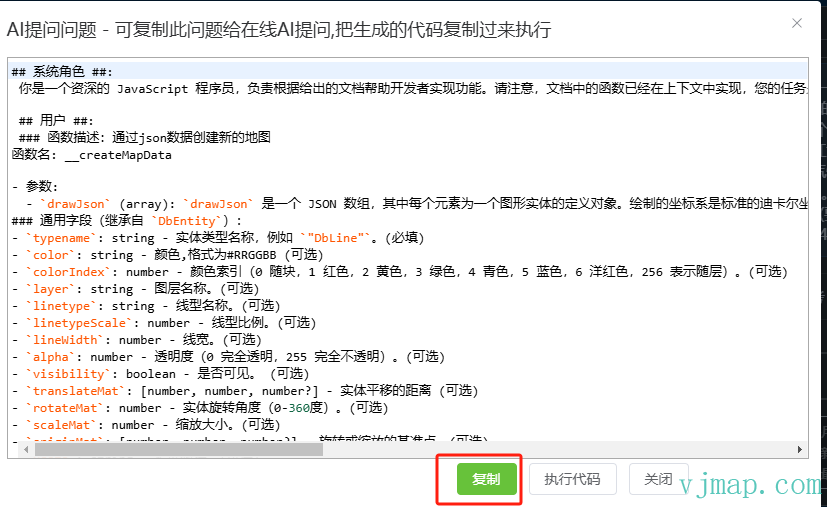
- Click Send. In the "AI Question" dialog, click "Copy" to copy the question.
- Open an online AI site like deepseek (opens new window), paste the content
- Copy the AI-generated code
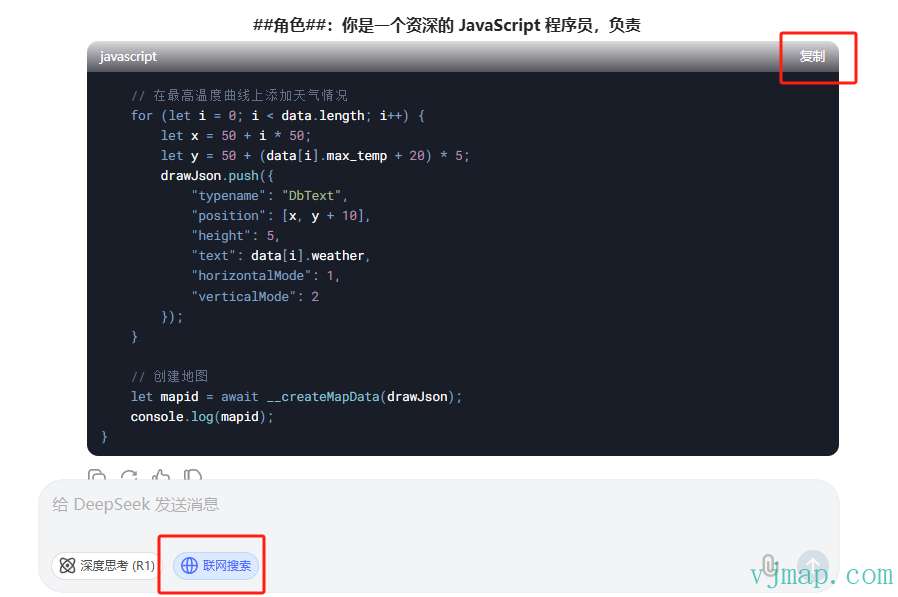
- Copy the AI-generated code
- In the "AI Question" dialog click "Execute Code" or use the toolbar menu "Execute Code", paste the code, click Execute
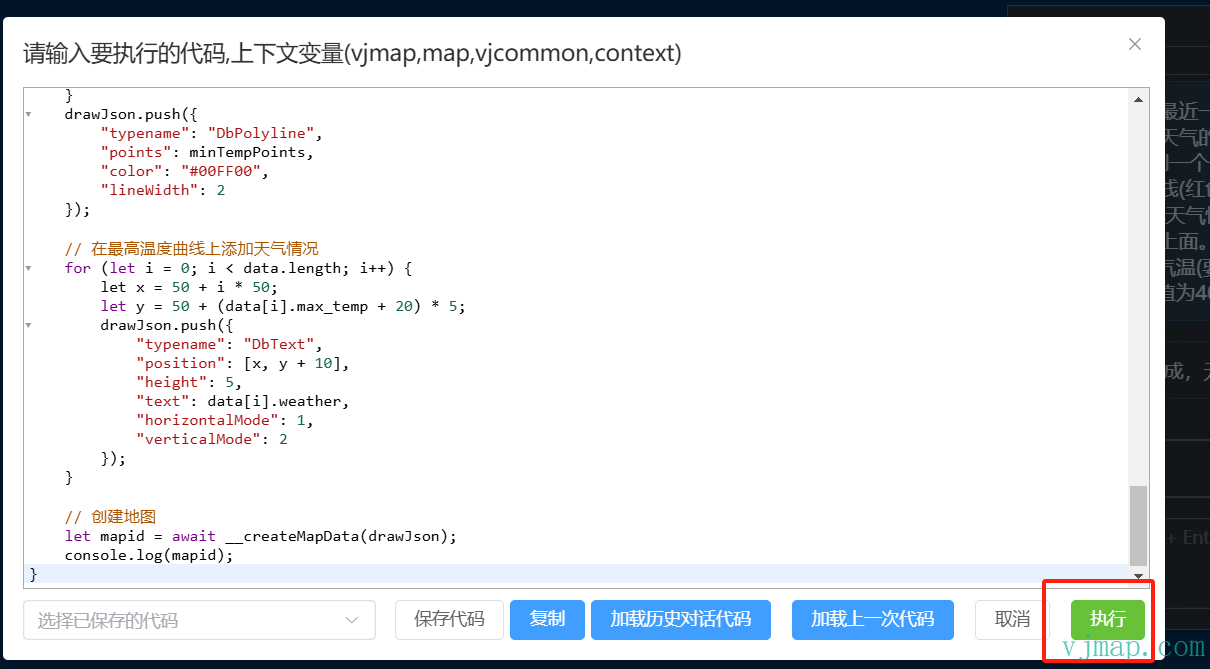
- In the "AI Question" dialog click "Execute Code" or use the toolbar menu "Execute Code", paste the code, click Execute
- When execution finishes, view the result
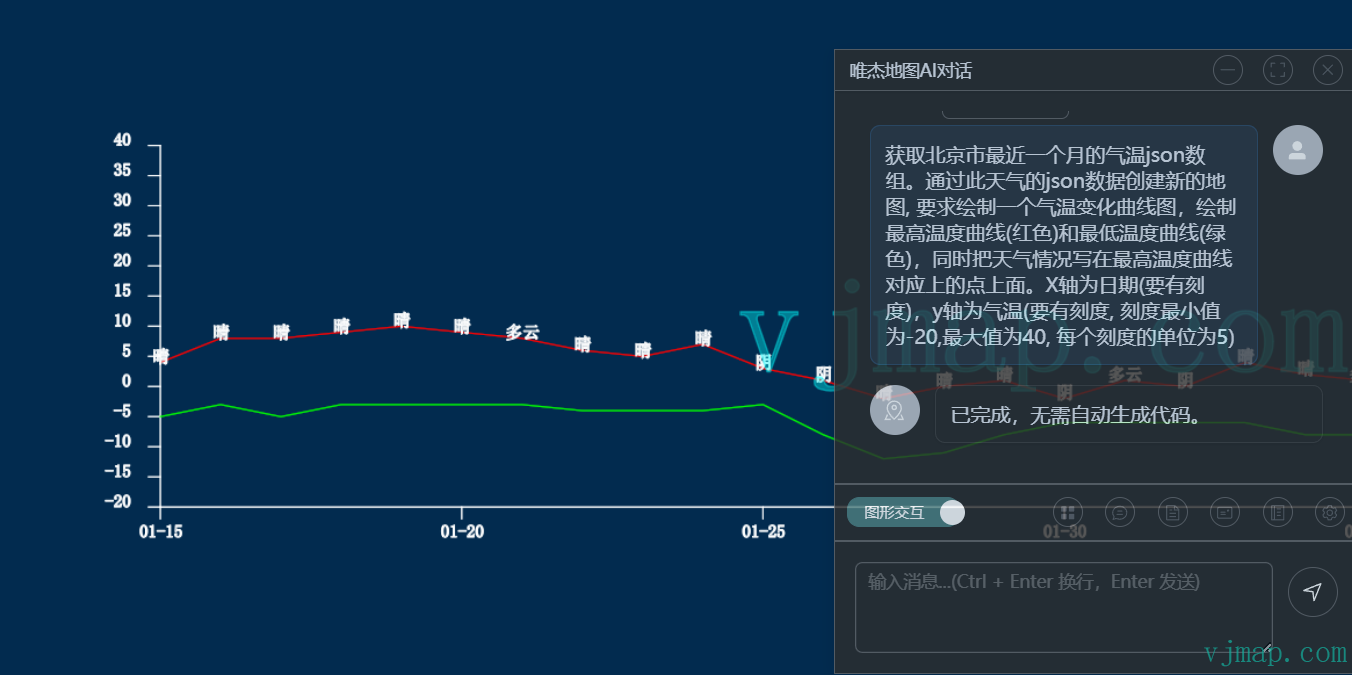
- When execution finishes, view the result