# Quick Start
# Video Tutorials
VJMAP Overview Video Tutorial (opens new window)
VJMAP Management Platform Introduction (opens new window)
VJMAP Demo Introduction (opens new window)
# Upload Graphics
- Upload graphics via the Upload Graphics (opens new window) feature provided by the VJMAP Cloud Drawing Management Platform (opens new window) (recommended), or via the Upload Graphics (opens new window) feature in the demo examples, or implement upload yourself using the official SDK.
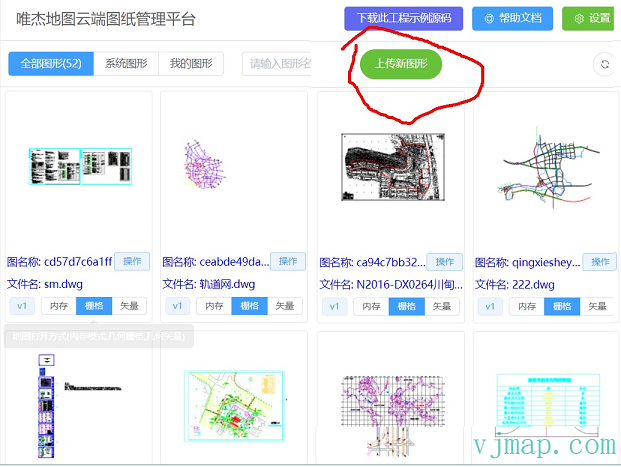
After a successful upload, assign a map name ID
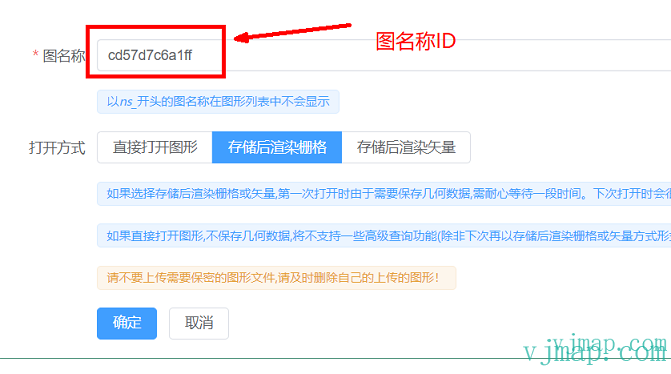
Note
If you choose to store and render as raster or vector, the first time you open the map it may take some time to wait as geometric data needs to be saved. It will open much faster the next time.
When uploading, give the map a unique map name mapid, which will be used in future development to display the graphic

For project-based development, please refer to the Sample Code Download (opens new window) for HTML, Vue, and React applications
For project-based development, install the SDK via
npm install vjmap
  import 'vjmap/dist/vjmap.min.css' // Styles must be imported!!!
  import vjmap from 'vjmap';
2
Note
The free trial version does not provide private deployment. Connect directly to the official service for trial. It has watermarks, file size limits for uploads, and uploaded data may be cleared periodically. Features are the same as the official version. For official version private deployment, please contact customer service.
# Open Map via Service
Use the openMap method of the Service object to open maps that already exist on the server, or pass a fileid with an http network path or server local path to open a DWG format CAD graphic.
// Create a new map service object with service URL and token
let svc = new vjmap.Service(env.serviceUrl, env.accessToken)
// Open map
let res = await svc.openMap({
    mapid: "sys_world", // Map ID (map name assigned when uploading graphics)
    mapopenway: vjmap.MapOpenWay.GeomRender, // Open with geometric data rendering
    // When opening this map for the first time, fileid must be passed; it is not needed for subsequent opens
    // fileid: "obtained from uploadMap, or an http URL of a dwg file, or a local file name under a fixed server directory, or json data for a new map
    style: vjmap.openMapDarkStyle() // Server rendering style
})
if (res.error) {
    message.error(res.error)
}
2
3
4
5
6
7
8
9
10
11
12
13
Note
Opening a new map:
First openMap: Assign a unique mapid as the map name
When opening this map for the first time, fileid must be passed; it is not needed for subsequent opens
fileid can be one of the following:
(1) Obtain a fileid from uploadMap
(2) An http URL of a dwg file
(3) A local file name under a fixed server directory
(4) Or json data for a new map
After that, open the graphic directly via mapid without passing fileid again
# Create Map Object
Use the geographic bounds returned from opening the map to establish a coordinate system, then create the map object
// Create geometric projection coordinate system based on map bounds
let prj = new vjmap.GeoProjection(res.bounds);

// Map object
let map = new vjmap.Map({
    container: 'map', // DIV container ID
    style: svc.vectorStyle(), // Style, vector tile style here
    center: prj.toLngLat(prj.getMapExtent().center()), // Set map center point
    zoom: 2, // Set map zoom level
    pitch: 60, // Tilt angle
    renderWorldCopies: false // Do not display multi-screen map
});

// Associate service object and projection object
map.attach(svc, prj);
2
3
4
5
6
7
8
9
10
11
12
13
14
15
Note
VJMAP also supports loading CAD maps with openlayers, leaflet, and maptalks
For openlayers development, refer to: https://vjmap.com/demo/#/demo/map/openlayers/01olraster
For leaflet development, refer to: https://vjmap.com/demo/#/demo/map/leaflet/01leafletraster
For maptalks development, refer to: https://vjmap.com/demo/#/demo/map/maptalks/01maptalksraster
# Get Map Bounds
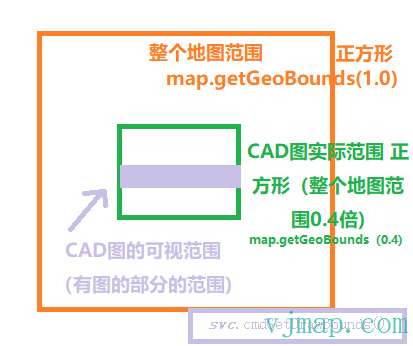
Full map bounds map.getGeoBounds(1.0) // Square
CAD graphic actual bounds (0.4x full map bounds) map.getGeoBounds(0.4) // Square
CAD graphic visible bounds (bounds of the area with graphics)
Method 1: Accurate bounds, slightly slower let dataBounds = await svc.cmdGetDrawBounds(); // Get the bounds of the area with map data
Method 2: Approximately accurate bounds, faster svc.currentMapParam().drawBounds
# Map Interaction
When the mouse is over an entity on the map, you may want to highlight it or click to view. In vector tile mode, call enableVectorLayerHoverHighlight; in raster tile mode, call enableLayerClickHighlight
// Get all layers
const layers = svc.getMapLayers();
// Entity type ID and name mapping
const { entTypeIdMap } = await svc.getConstData();

// With highlight state (highlights when mouse is over map element)
map.enableVectorLayerHoverHighlight((event, feature, layer) => {
    // Click highlight entity callback event
    const prop = feature.properties;
    let content = `event: ${event}; feature: ${feature.id}; layer: ${layers[prop.layer].name}; type: ${entTypeIdMap[prop.type]}`
    message.info({ content, key: "info", duration: 5});
})
2
3
4
5
6
7
8
9
10
11
12
# Add Overlays or Other Layers
The map provides the ability to draw overlays on top of the map, such as point markers, plain text markers, polylines, circles, polygons, rectangles, and other shapes. When drawing, you can set titles and icons for point markers, set color and width for polylines, and set fill color, border color, width and many other custom properties for shapes (circles, polygons, rectangles).
Add a marker overlay
const mapBounds = map.getGeoBounds(0.6); // Get map geographic bounds and scale
let position = mapBounds.randomPoint(); // Generate a random point coordinate within this geographic bounds
let latLng = map.toLngLat(position); // Convert geographic coordinates to longitude/latitude
let marker = new vjmap.Marker(); // Create a new Marker
marker.setLngLat(latLng).addTo(map); // Set coordinates and add to map
2
3
4
5
Create many extruded square layers
let lengthMin = mapBounds.width() / 200; // Minimum length for randomly generated square sides
let lengthMax = mapBounds.width() / 100; // Maximum length for randomly generated square sides
let geoDatas = []; // Data
for(let i = 0; i < 100; i++) {
    const pts = [];
    const len = vjmap.randInt(lengthMin, lengthMax); // Randomly generate a length within the range
    const p1 = mapBounds.randomPoint(); // Randomly generate a point within this bounds as the bottom-right corner of the square
    const p2 = vjmap.geoPoint([p1.x, p1.y + len]);
    const p3 = vjmap.geoPoint([p1.x + len, p1.y + len]);
    const p4 = vjmap.geoPoint([p1.x + len, p1.y]);
    pts.push(p1, p2, p3, p4); // Four corner coordinates of the square
    geoDatas.push({
        points: map.toLngLat(pts), // Need to convert geographic coordinates to longitude/latitude for drawing
        properties: {
            name: "square" + (i + 1),
            color:  vjmap.randomColor(),
            type: "square",
            baseHeight: 0,
            height: prj.toMeter(vjmap.randInt(lengthMin * 10, lengthMax * 10)) // Height, randomly generated as 10x the min/max length above
        }
    })
}

// Create extruded object layer
let fillExtrusions = new vjmap.FillExtrusion({
    data: geoDatas, // Data
    // When hover state, use red; when not hover, use 'color' from properties
    fillExtrusionColor: ['case', ['to-boolean', ['feature-state', 'hover']], 'red', ['get', 'color']],
    fillExtrusionOpacity: 0.8, // Opacity
    fillExtrusionHeight:['get', 'height'], // Height value
    fillExtrusionBase: ['get', 'baseHeight'], // Base height, change this for floating effect
    isHoverPointer: true, // Changes cursor when mouse is over
    isHoverFeatureState: true // Changes state value when mouse is over for highlight effect
});
fillExtrusions.addTo(map); // Add to map
// Click event
fillExtrusions.clickLayer(e => message.info(`You clicked the ${e.features[0].id}th one, named ${e.features[0].properties.name}, color ${e.features[0].properties.color} ${e.features[0].properties.type}`))
// Hover event
fillExtrusions.hoverPopup(f => `<h3>ID: ${f.properties.name}</h3>Color: ${f.properties.color}`, { anchor: 'bottom' });
2
3
4
5
6
7
8
9
10
11
12
13
14
15
16
17
18
19
20
21
22
23
24
25
26
27
28
29
30
31
32
33
34
35
36
37
38
39
# Complete Code
<!DOCTYPE html>
<html lang="en">
<head>
    <meta charset="UTF-8">
    <title>vjmap demo</title>
    <link rel="stylesheet" type="text/css" href="https://vjmap.com/demo/js/vjmap/vjmap.min.css">
    <script type="text/javascript" src="https://vjmap.com/demo/js/vjmap/vjmap.min.js"></script>
</head>
<body style=" margin: 0;overflow: hidden;background-color:white;font-size: 16px">
<div id="map" style="left:0;right:0;top:0;bottom:0;position: absolute;z-index: 0;"></div>
</body>
<script>
    window.onload = async () => {
        document.body.style.background = "#022B4F"; // Change background to dark color
        const env = {
            serviceUrl: "https://vjmap.com/server/api/v1",
            accessToken: "eyJhbGciOiJIUzI1NiIsInR5cCI6IkpXVCJ9.eyJJRCI6MiwiVXNlcm5hbWUiOiJhZG1pbjEiLCJOaWNrTmFtZSI6ImFkbWluMSIsIkF1dGhvcml0eUlkIjoiYWRtaW4iLCJCdWZmZXJUaW1lIjo4NjQwMCwiZXhwIjoxOTQyMzg5NTc0LCJpc3MiOiJ2am1hcCIsIm5iZiI6MTYyNzAyODU3NH0.VQchVXxgjl5aCp3j3Uf5U2Mpk1NJNirH62Ys-8XOfnY",
            exampleMapId: "sys_zp"
        };
        try {
            // Create a new map service object with service URL and token
			let svc = new vjmap.Service(env.serviceUrl, env.accessToken)
			// Open map
			let res = await svc.openMap({
				mapid: "helloVjmap", // Map ID (each time this map ID is opened, it will get the dwg path from fileid to open, then read from cache)
				fileid: "mapfiles/ccf12a1f8711.dwg", // Must be relative path, relative to the data directory under the server program installation directory
				mapopenway: vjmap.MapOpenWay.GeomRender, // Open with geometric data rendering
				style: vjmap.openMapDarkStyle() // Server rendering style
			})
			if (res.error) {
				console.error(res.error)
			}
			// Create geometric projection coordinate system based on map bounds
			let prj = new vjmap.GeoProjection(res.bounds);

			// Map object
			let map = new vjmap.Map({
				container: 'map', // DIV container ID
				style: svc.vectorStyle(), // Style, vector tile style here
				center: prj.toLngLat(prj.getMapExtent().center()), // Set map center point
				zoom: 2, // Set map zoom level
				pitch: 60, // Tilt angle
				renderWorldCopies: false // Do not display multi-screen map
			});

			// Associate service object and projection object
			map.attach(svc, prj);

			// Get all layers
			const layers = svc.getMapLayers();
			// Entity type ID and name mapping
			const { entTypeIdMap } = await svc.getConstData();

			// With highlight state (highlights when mouse is over map element)
			map.enableVectorLayerHoverHighlight((event, feature, layer) => {
				// Click highlight entity callback event
				const prop = feature.properties;
				let content = `event: ${event}; feature: ${feature.id}; layer: ${layers[prop.layer].name}; type: ${entTypeIdMap[prop.type]}`
				map.logInfo(content)
			})

			// Wait for map to load before adding other layers below
			await map.onLoad();

			// Add a marker overlay
			const mapBounds = map.getGeoBounds(0.6); // Get map geographic bounds and scale
			let position = mapBounds.randomPoint(); // Generate a random point coordinate within this geographic bounds
			let latLng = map.toLngLat(position); // Convert geographic coordinates to longitude/latitude
			let marker = new vjmap.Marker(); // Create a new Marker
			marker.setLngLat(latLng).addTo(map); // Set coordinates and add to map

			// Create many extruded square layers
			let lengthMin = mapBounds.width() / 200; // Minimum length for randomly generated square sides
			let lengthMax = mapBounds.width() / 100; // Maximum length for randomly generated square sides
			let geoDatas = []; // Data
			for(let i = 0; i < 100; i++) {
				const pts = [];
				const len = vjmap.randInt(lengthMin, lengthMax); // Randomly generate a length within the range
				const p1 = mapBounds.randomPoint(); // Randomly generate a point within this bounds as the bottom-right corner of the square
				const p2 = vjmap.geoPoint([p1.x, p1.y + len]);
				const p3 = vjmap.geoPoint([p1.x + len, p1.y + len]);
				const p4 = vjmap.geoPoint([p1.x + len, p1.y]);
				pts.push(p1, p2, p3, p4); // Four corner coordinates of the square
				geoDatas.push({
					points: map.toLngLat(pts), // Need to convert geographic coordinates to longitude/latitude for drawing
					properties: {
						name: "square" + (i + 1),
						color:  vjmap.randomColor(),
						type: "square",
						baseHeight: 0,
						height: prj.toMeter(vjmap.randInt(lengthMin * 10, lengthMax * 10)) // Height, randomly generated as 10x the min/max length above
					}
				})
			}

			// Create extruded object layer
			let fillExtrusions = new vjmap.FillExtrusion({
				data: geoDatas, // Data
				// When hover state, use red; when not hover, use 'color' from properties
				fillExtrusionColor: ['case', ['to-boolean', ['feature-state', 'hover']], 'red', ['get', 'color']],
				fillExtrusionOpacity: 0.8, // Opacity
				fillExtrusionHeight:['get', 'height'], // Height value
				fillExtrusionBase: ['get', 'baseHeight'], // Base height, change this for floating effect
				isHoverPointer: true, // Changes cursor when mouse is over
				isHoverFeatureState: true // Changes state value when mouse is over for highlight effect
			});
			fillExtrusions.addTo(map); // Add to map
			// Click event
			fillExtrusions.clickLayer(e => map.logInfo(`You clicked the ${e.features[0].id}th one, named ${e.features[0].properties.name}, color ${e.features[0].properties.color} ${e.features[0].properties.type}`))
			// Hover event
			fillExtrusions.hoverPopup(f => `<h3>ID: ${f.properties.name}</h3>Color: ${f.properties.color}`, { anchor: 'bottom' });

        }
        catch (e) {
            console.error(e);
        }
    };
</script>
</html>
2
3
4
5
6
7
8
9
10
11
12
13
14
15
16
17
18
19
20
21
22
23
24
25
26
27
28
29
30
31
32
33
34
35
36
37
38
39
40
41
42
43
44
45
46
47
48
49
50
51
52
53
54
55
56
57
58
59
60
61
62
63
64
65
66
67
68
69
70
71
72
73
74
75
76
77
78
79
80
81
82
83
84
85
86
87
88
89
90
91
92
93
94
95
96
97
98
99
100
101
102
103
104
105
106
107
108
109
110
111
112
113
114
115
116
117
118
119