# Map Customization
# Backend Map Customization
Customize backend rendering with style expressions. Works with both raster and vector tiles; rendering may have slight delay.
/**
  * Get style layer name
  * @param style Style parameters
  * @param mapid Map ID
  * @param version Version; empty for latest
  * @param isGeomLayer Prefer geometry render layer (default true)
  * @return {Promise<any>}
  */
 createStyle(style: {
    /** Style name. */
    name?: string;
    /** Layer index list to turn on, e.g. [0,1,3]. */
    layeron?: string | number[];
    /** Layer index list to turn off, e.g. [2,4]. Use either layeron or layeroff */
    layeroff?: string | number[];
    /** Map clip bounds, format [x1,y1,x2,y2]. If only a number, it means zoom factor */
    clipbounds?: [number, number, number, number] | number;
    /** Background color. */
    backcolor?: number;
    /** Line weight, e.g. [1,1,1,1,0] for levels 1–4 on, level 5 off; levels above 5 follow last level */
    lineweight?: string | number[];
    /** Expression. */
    expression?: string;
}, mapid?: string, version?: string, isGeomLayer?: boolean): Promise<any>;
1
2
3
4
5
6
7
8
9
10
11
12
13
14
15
16
17
18
19
20
21
22
23
24
2
3
4
5
6
7
8
9
10
11
12
13
14
15
16
17
18
19
20
21
22
23
24
For expression syntax, see Server-side rendering expression syntax and Server-side conditional query and expression query
# Example: "Tech Blue" expression
var color := gFilterCustomTheme(gInColorRed, gInColorGreen, gInColorBlue, 200, 200, 0.1);
gOutColorRed[0] := gRed(color);
gOutColorGreen[0] := gGreen(color);
gOutColorBlue[0] := gBlue(color);
1
2
3
4
2
3
4
More Custom map style examples (opens new window)
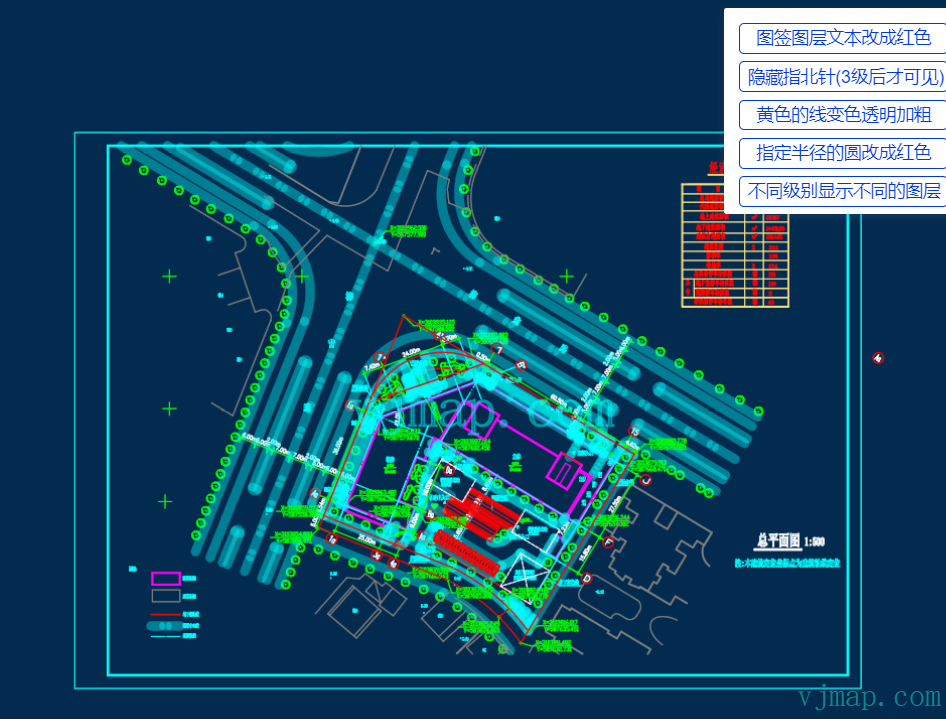
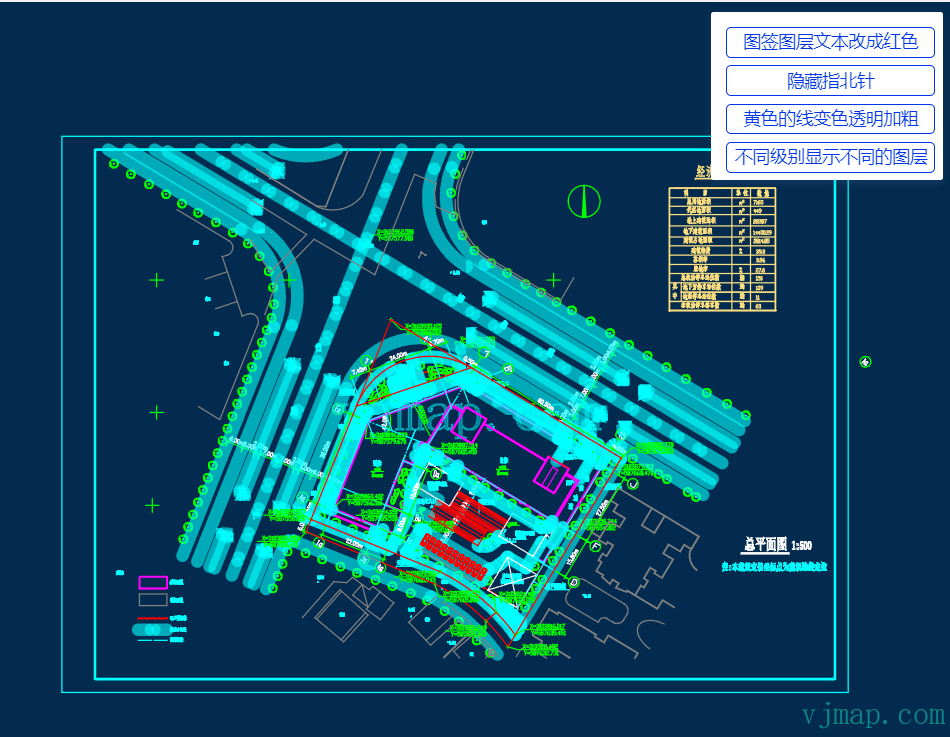
# Change map label layer text to red
Expression:
if((gInFeatureType=='AcDbText' or gInFeatureType=='AcDbMText' or gInFeatureType=='AcDbAttributeDefinition' or gInFeatureType=='AcDbAttribute') and (gInLayerName=='WZ')) {
    gOutColorRed:=255;
    gOutColorGreen:=0;
    gOutColorBlue:=0;
}
1
2
3
4
5
2
3
4
5
# Hide compass (visible only after level 3)
Expression:
if(gInObjectId  in  '10D_10F__111_#||10D_10F__110_#') {
    gOutVisible[2]:=0;
    gOutVisible[4]:=1;
}
1
2
3
4
2
3
4
# Yellow lines: change color, transparency, and thickness
Expression:
if((gInColorRed==255 and gInColorGreen==255 and gInColorBlue==0)) {
    gOutLineWidth:=5;
    gOutColorRed:=0;
    gOutColorGreen:=255;
    gOutColorBlue:=255;
    gOutColorAlpha:=100;
}
1
2
3
4
5
6
7
2
3
4
5
6
7
# Change circles with specified radius to red
Expression:
if(((abs(gInExtendMaxX-gInExtendMinX-4000)<20))) {
    gOutColorRed:=255;
    gOutColorGreen:=0;
    gOutColorBlue:=0;
}
1
2
3
4
5
2
3
4
5
# Show different layers at different zoom levels
Use layeron in the style object:
let style = {
        // layeroff controls layer indices to turn off at each level; layeron controls layer indices to turn on
        layeron:`{
                        "*": "()",
                        "1": "(19,24)",
                        "2": "(19,24,5)",
                        "3-4": "(1,19,24,5,22)",
                        "5": "(1,19,24,5,22,15)",
                        "6-7": "(1,2,3,4,5,6,7,8,9,10,11,12,13,14,15,16,19,22,24)"
                    }`
}
1
2
3
4
5
6
7
8
9
10
11
2
3
4
5
6
7
8
9
10
11
View example online (opens new window)
# Frontend Map Customization (Vector Tiles)
Modify vector tile styles on the frontend for rendering. Fast, but only for vector tiles.
Frontend style expression syntax
# Change map label layer text to red
const customColorCaseExpr = [
    [
        "all",
        [
            "any",
            [
                "==",
                [
                    "get",
                    "type"
                ],
                13
            ],
            [
                "==",
                [
                    "get",
                    "type"
                ],
                12
            ],
            [
                "==",
                [
                    "get",
                    "type"
                ],
                26
            ],
            [
                "==",
                [
                    "get",
                    "type"
                ],
                27
            ]
        ],
        [
            "match",
            [
                "get",
                "layer"
            ],
            [
                24
            ],
            true,
            false
        ]
    ],
    "#ff0000"
]
let newStyle = svc.vectorStyle({
        customColorCaseExpr
});
map.setStyle(newStyle);
1
2
3
4
5
6
7
8
9
10
11
12
13
14
15
16
17
18
19
20
21
22
23
24
25
26
27
28
29
30
31
32
33
34
35
36
37
38
39
40
41
42
43
44
45
46
47
48
49
50
51
52
53
54
55
56
57
2
3
4
5
6
7
8
9
10
11
12
13
14
15
16
17
18
19
20
21
22
23
24
25
26
27
28
29
30
31
32
33
34
35
36
37
38
39
40
41
42
43
44
45
46
47
48
49
50
51
52
53
54
55
56
57
# Yellow lines: change color, transparency, and thickness
const customColorCaseExpr = [
    [
        "any",
        [
            "==",
            [
                "get",
                "color"
            ],
            "#ffff00"
        ]
    ],
    "#00ffff"
]
let newStyle = svc.vectorStyle({
        customColorCaseExpr
});
map.setStyle(newStyle);
1
2
3
4
5
6
7
8
9
10
11
12
13
14
15
16
17
18
2
3
4
5
6
7
8
9
10
11
12
13
14
15
16
17
18
View example online (opens new window)
# Frontend Map Customization (Raster Tiles)
For raster tile layers, you can set layer style, invert, saturation, and contrast on the frontend.
Set layer custom style online example (opens new window)
let styleStyle = svc.rasterStyle();
// Set initial style values
styleStyle.layers[0].paint = {
	...styleStyle.layers[0].paint,
	// Custom map style
	"raster-inverse": 1, //  0 no invert 1 invert
	"raster-monochrome": "#4586b6", // // Replace map style with solid color
	"raster-saturation": 0, // Saturation  -1 to 1
	"raster-contrast": 0, // Contrast  -1 to 1
}
// Map object
let map = new vjmap.Map({
	container: 'map', // DIV container ID
	style: styleStyle, // Style, raster style here
	center: prj.toLngLat(prj.getMapExtent().center()), // Map center
	zoom: 2, // Zoom level
	renderWorldCopies: false // No multi-world copy
});
// Attach service and projection
map.attach(svc, prj);
await map.onLoad()
let layerId = "raster-layer"
// Invert
//map.setRasterInverse(layerId, 1) // 0 no invert 1 invert
// Monochrome
//map.setRasterMonochrome(layerId, "#4586b6")
// Saturation
// map.setRasterSaturation(layerId, 0) // -1 to 1
// Contrast
// map.setRasterContrast(layerId, 0) // -1 to 1
// Brightness min
//  map.setRasterBrightnessMin(layerId, 0.5) // 0 to 1
// Brightness max
//  map.setRasterBrightnessMax(layerId, 1) // 0 to 1
1
2
3
4
5
6
7
8
9
10
11
12
13
14
15
16
17
18
19
20
21
22
23
24
25
26
27
28
29
30
31
32
33
34
2
3
4
5
6
7
8
9
10
11
12
13
14
15
16
17
18
19
20
21
22
23
24
25
26
27
28
29
30
31
32
33
34