# Raster Tiles and Vector Tiles
# Tile Map
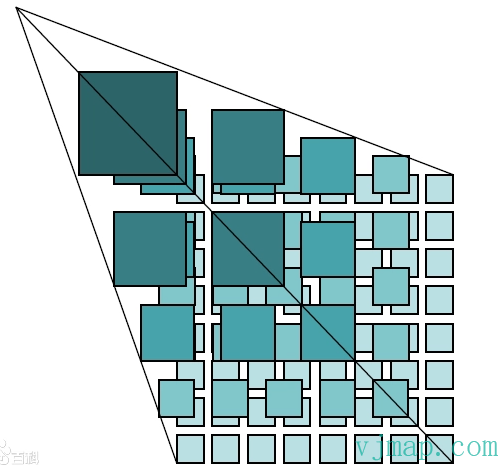
Concept: The tile map pyramid model is a multi-resolution model. From the bottom to the top of the pyramid, resolution decreases while the geographic extent stays the same. First determine the number of zoom levels N. For the highest zoom level and largest map scale, use that as the base (level 0) and tile it. Starting from the top-left, tiles are cut from left to right and top to bottom into equal-sized squares (e.g. 256x256 pixels) to form the level 0 tile matrix. For level 1, each pixel is split into 2×2 pixels to generate the level 1 image, which is then tiled into the same-sized squares to form the level 1 tile matrix. Continue for level 2 and so on until level N-1, forming the full tile pyramid.
Map caching is an effective way to improve online map access performance by trading space for time. Tile maps can be classified as raster tiles and vector tiles.
# Raster Tiles
Concept: All map layers are cut and stored as raster-format map tiles.
Advantages: Widely used, mature technology
# Raster Tile Principles and Mechanism
Raster tiles use a quadtree pyramid model. The map is cut into many equal-sized rectangular raster images, which are assembled in a defined order to form different zoom levels.
# Vector Tiles
Concept: Vector layers are cut and stored as vector tiles.
Advantages: High creation efficiency, fast transmission and rendering, client-side customizable styling
# Vector Tile Principles and Mechanism
Vector tiles are similar to raster tiles. Vector data is split into a multi-level model and stored as vector feature description files on the server. The client then renders the map according to specified styles. Each vector tile stores geometry and attributes for a rectangular region. After the client receives vector tiles, fonts, icons, and style files from the network, it renders the final map.
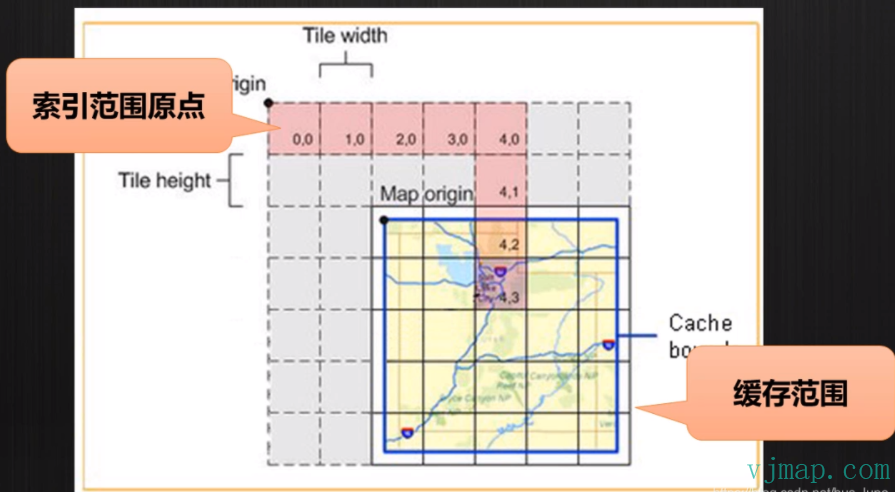
Vector tile data is organized in two layers: one for the tile dataset organization model within the map extent, and one for the organization of features within each tile.
The vector tile dataset organization is similar to the raster tile pyramid model. It includes coordinate system, projection, tile numbering, spatial position and tile correspondence, and is compatible with raster tile specifications. This facilitates conversion between vector and raster tiles.
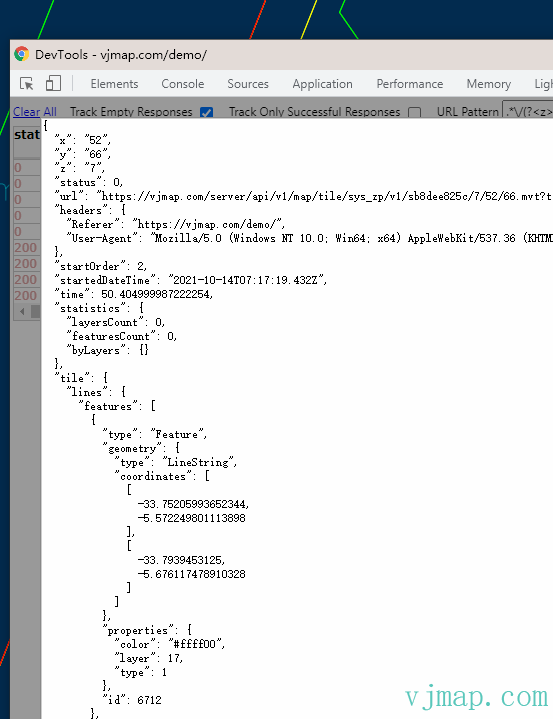
Within each tile, geometry and attributes are stored separately. Geometry includes point, line, polygon, and unknown feature types. Metadata includes layer and feature attributes.
Vector tile data example:
# Raster vs Vector Tiles
| Item | Vector Tiles | Raster Tiles |
|---|---|---|
| Map Tiles | Vector data organized and defined in description files; rendered client-side in real time | Pre-rendered PNG or other image collections on the server |
| Tile Size | Small | Large |
| Tile Generation Efficiency | High | Low |
| Update Mechanism | Comparable | Comparable |
| Style Modification | Supported | Not supported |
| Frontend Requirements | High (HTML5) | Low |
| Display Differences | Yes | No |
| Maturity | Moderate | High |
| Use Cases | Special (mobile, style customization) | Broad |
| Management | Comparable | Comparable |
| Advantages | Disadvantages | |
|---|---|---|
| Vector Tiles | Low storage, efficient tile generation, fast rendering, dynamic style adjustment, high resolution | Higher client performance requirements, compatibility issues on older devices; slower loading when graphics are large |
| Raster Tiles | Pre-rendered tiles, low client performance requirements, stable performance | High storage, low tile generation efficiency, no dynamic style adjustment, lower resolution, slower loading |
# Implementation
VJMap (opens new window) provides a complete solution for CAD-to-WebGIS visualization. It fully supports DWG format, 2D/3D switching, high-performance WebGL rendering, custom styling, and cross-platform private deployment. Both raster and vector tiles are supported. To display CAD maps via raster or vector tiles on the web, you only need two steps:
Step 1: Set the render mode to GeomRender
Step 2: Set the style to raster (rasterStyle) or vector (vectorStyle)
Example code:
// --Open map [vector tiles]--Open uploaded CAD DWG as vector tiles
// js code
// Create map service object with service URL and token
let svc = new vjmap.Service(env.serviceUrl, env.accessToken)
// Open map
let res = await svc.openMap({
    mapid: env.exampleMapId, // Map ID (ensure it exists; you can upload a new file to create one)
    mapopenway: vjmap.MapOpenWay.GeomRender, // Open with geometry rendering
    style: vjmap.openMapDarkStyle() // Use dark background style when div has dark background
})
if (res.error) {
    message.error(res.error)
}
// Get map extent
let mapExtent = vjmap.GeoBounds.fromString(res.bounds);
// Create coordinate system
let prj = new vjmap.GeoProjection(mapExtent);

// Create map object
let map = new vjmap.Map({
    container: 'map', // container ID
    style: svc.vectorStyle(), // Vector tile style; use rasterStyle() for raster
    center: prj.toLngLat(mapExtent.center()), // Center
    zoom: 2,
    renderWorldCopies: false
});
// Attach service and projection to map
map.attach(svc, prj);
// Fit map to bounds
map.fitMapBounds();
// Enable layer click highlight
map.enableLayerClickHighlight(svc, e => {
    let msg = {
        content: `type: ${e.name}, id: ${e.objectid}, layer: ${e.layerindex}`,
        key: "layerclick",
        duration: 5
    }
    e && message.info(msg);
})
2
3
4
5
6
7
8
9
10
11
12
13
14
15
16
17
18
19
20
21
22
23
24
25
26
27
28
29
30
31
32
33
34
35
36
37
38
39
# Demo
Raster tile example (opens new window)
Vector tile example (opens new window)